Indicator Library
What It Is
Strateda includes broad indicator coverage across all major strategy categories — trend, momentum, volatility, volume, and price-derived signals — drawn from the TA-Lib Python library. All 75 indicators are available for chart display on every plan including Free. A growing subset is available for use inside strategy signal conditions, covering all major categories so you can build and test a wide range of systematic strategies.
The right panel of the platform has two tabs that use these indicators in different ways:
- Indicator Tab — Browse the full list of indicators, set parameters, and click Apply to draw them on the chart. You can apply multiple indicators simultaneously, and each applied indicator has an eye icon to toggle its visibility. This is designed for exploring price behavior, comparing different indicators and parameter settings, and developing trading hypotheses.
- Strategy Tab — Select indicators from a dropdown together with parameters and open/exit conditions to build a complete strategy. Indicators selected here do not draw on the chart upon selection. Only when you click Run is a strategy job created. When the job results load, the chart displays the candle data together with the condition indicators and trade open/close lines.
All 75 indicators are available on every plan, including Free. There are no indicator restrictions based on subscription tier.
How to Access It
- Open the right panel in the platform interface.
- Select the Indicator tab to browse and apply indicators for chart analysis, or the Strategy tab to build strategy conditions (see No-Code Strategy Design).
- In the Indicator tab, browse the indicator list or search for a specific indicator by name.
- Select an indicator, set its parameters (e.g., time period), and click Apply to draw it on the chart.
The indicator list is a flat, scrollable list. You can apply multiple indicators simultaneously — there is no practical limit to the number of indicators displayed on a single chart. Each applied indicator has an eye icon to toggle its visibility on or off.
What You See
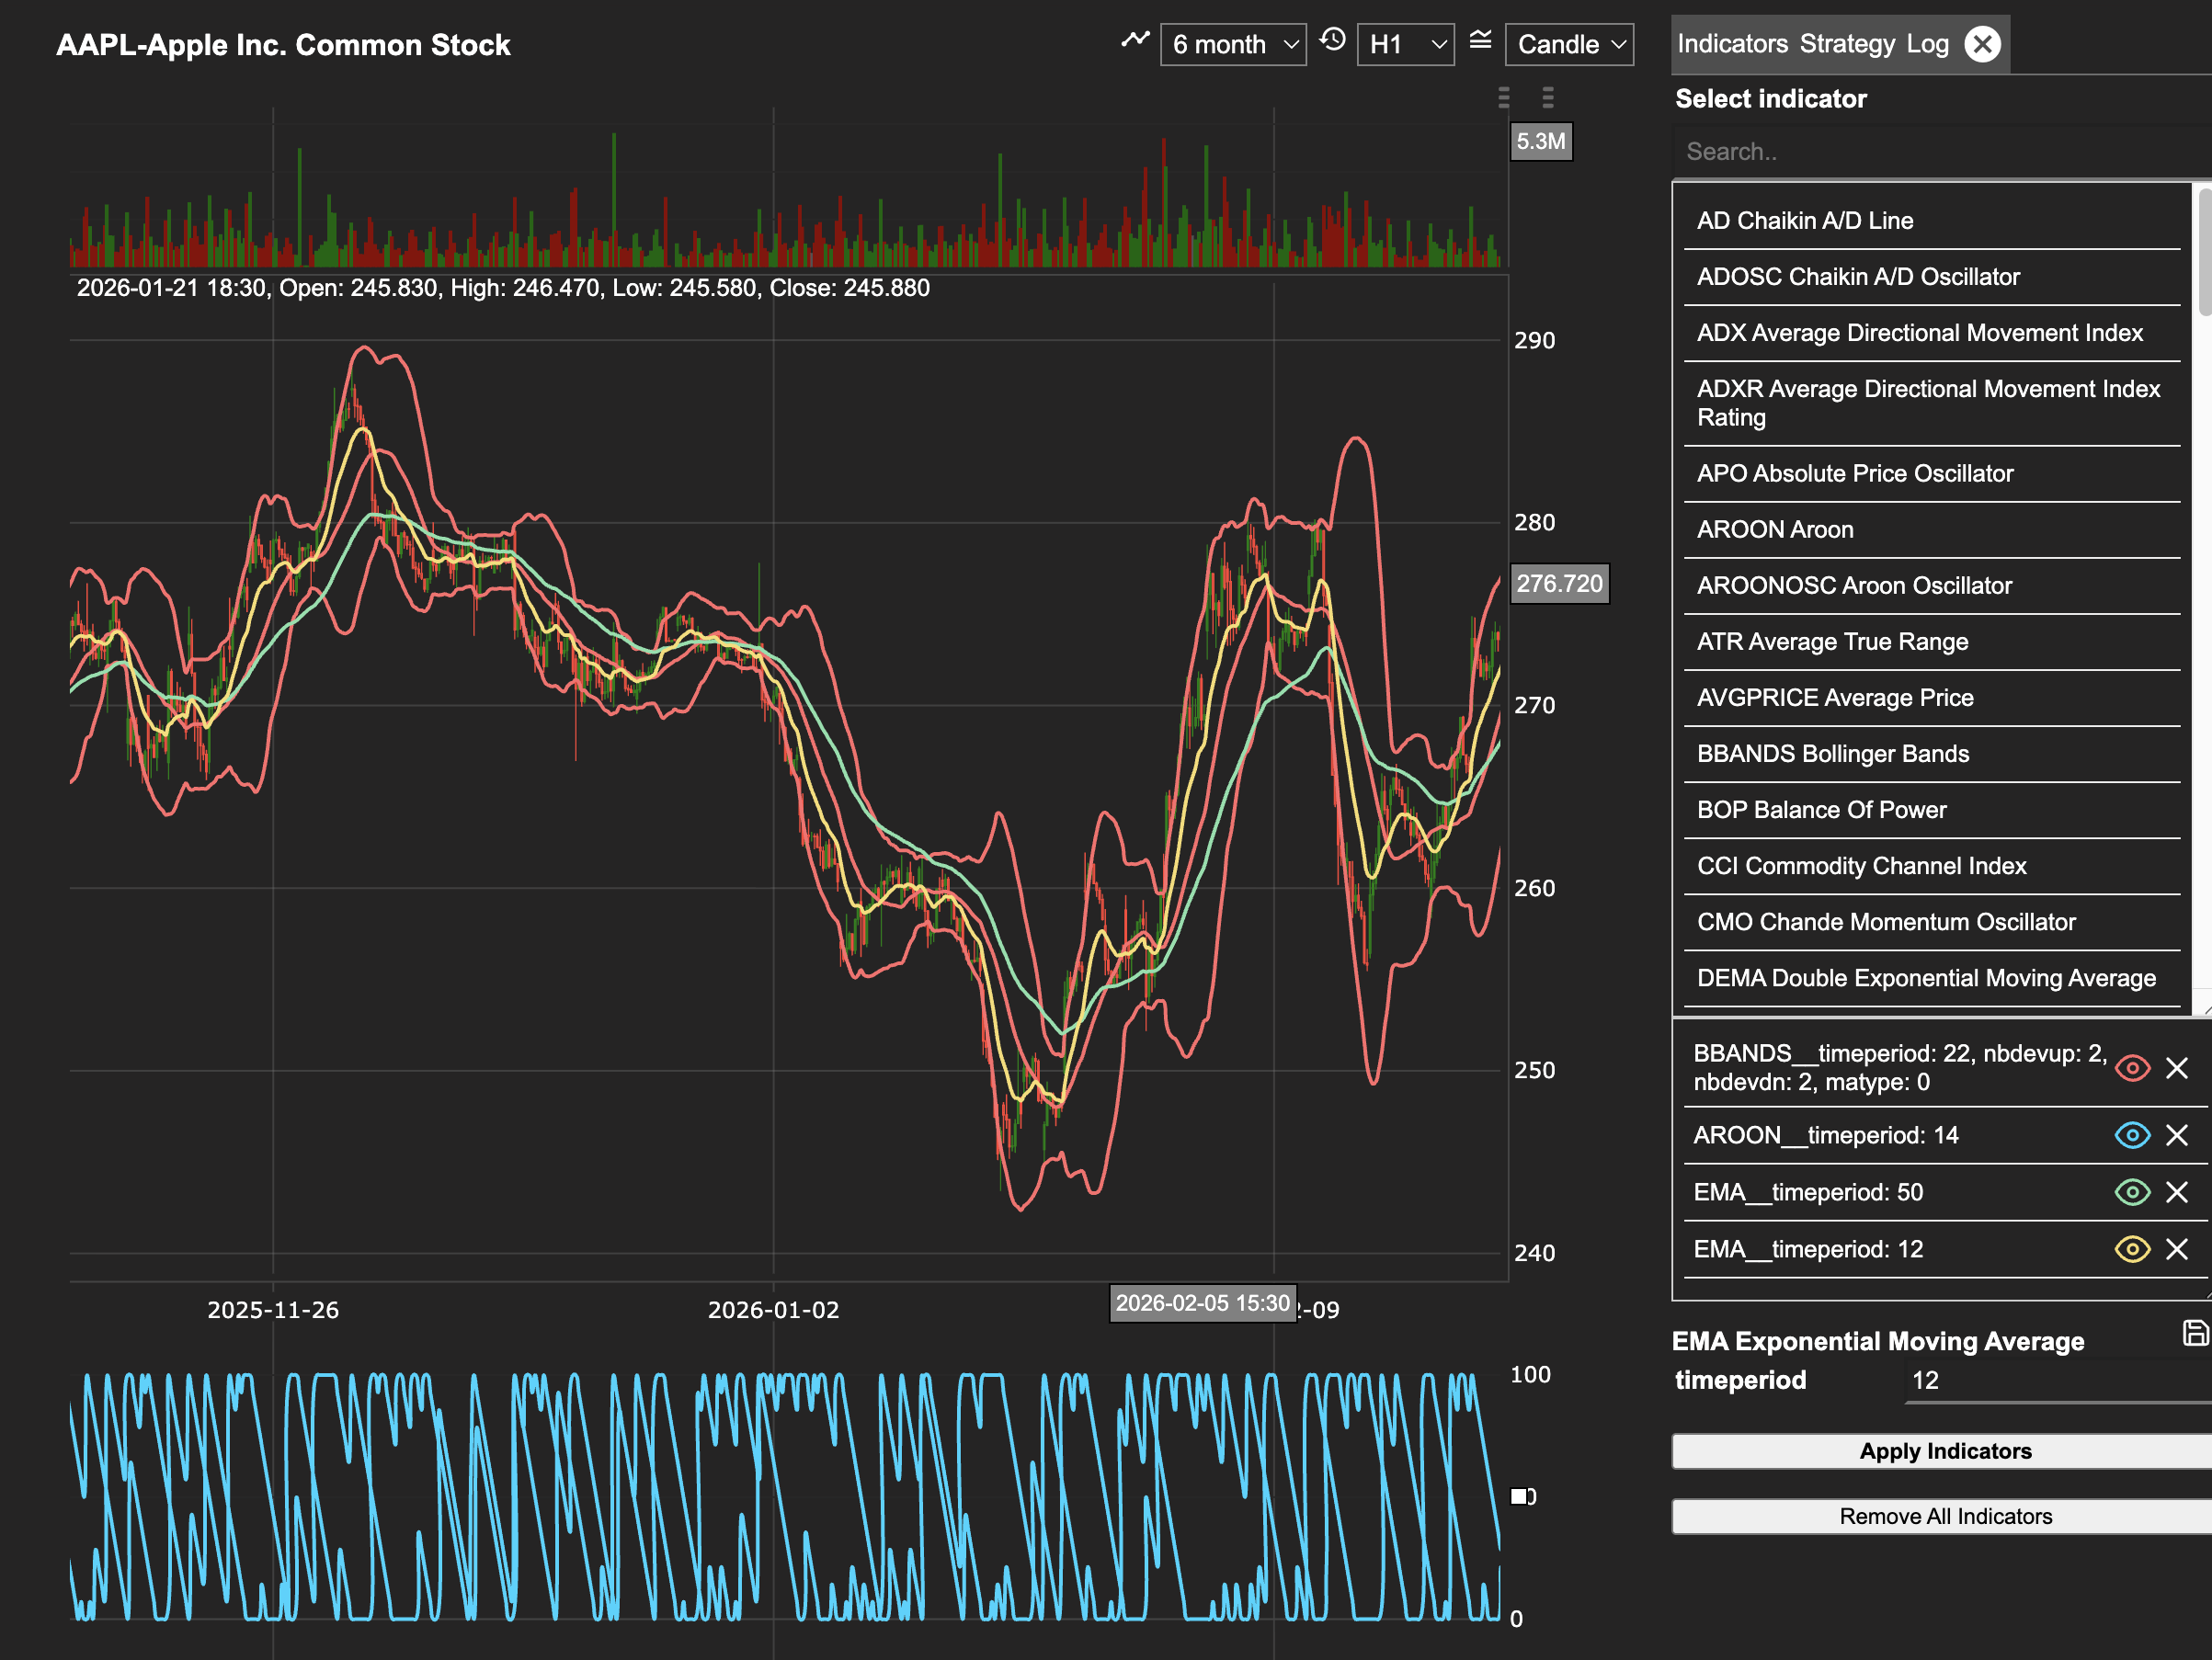
Chart Display vs Strategy Conditions
All 75 indicators are available for chart display in the Indicators tab — select any indicator to visualise it on the price chart alongside your data.
A curated subset of indicators is currently available for use inside strategy signal conditions (open and close signals in the Strategy Builder). These indicators are fully integrated with the Strateda signal generation engine, ensuring reliable crossover detection and limit evaluation across all supported instruments and timeframes.
The strategy-compatible indicators cover all major categories — trend following, momentum, volatility, volume, and price-derived signals — providing everything needed to build and test a wide range of systematic strategies. Additional indicators are being progressively integrated and will appear in the strategy condition selector as they become available.
Indicators marked ✅ in the tables below are available in both chart display and strategy conditions. Indicators marked 🔜 are available for chart display and will be added to strategy conditions in a future release.
Indicators by Category
The following tables group indicators by category. Indicators marked ✅ are available in strategy conditions now. Indicators marked 🔜 are available for chart display and will be added to strategy conditions in a future release.
Trend
| Code | Indicator | Strategy |
|---|---|---|
| ADX | Average Directional Movement Index | ✅ |
| ADXR | Average Directional Movement Index Rating | 🔜 |
| APO | Absolute Price Oscillator | 🔜 |
| AROON | Aroon | ✅ |
| AROONOSC | Aroon Oscillator | ✅ |
| DEMA | Double Exponential Moving Average | ✅ |
| DX | Directional Movement Index | 🔜 |
| EMA | Exponential Moving Average | ✅ |
| HT_DCPERIOD | Hilbert Transform — Dominant Cycle Period | 🔜 |
| HT_DCPHASE | Hilbert Transform — Dominant Cycle Phase | 🔜 |
| HT_PHASOR | Hilbert Transform — Phasor Components | 🔜 |
| HT_SINE | Hilbert Transform — SineWave | 🔜 |
| HT_TRENDLINE | Hilbert Transform — Instantaneous Trendline | ✅ |
| HT_TRENDMODE | Hilbert Transform — Trend vs Cycle Mode | 🔜 |
| KAMA | Kaufman Adaptive Moving Average | ✅ |
| MA | All Moving Average | ✅ |
| MACD | Moving Average Convergence/Divergence | ✅ |
| MACDEXT | MACD with controllable MA type | 🔜 |
| MACDFIX | Moving Average Convergence/Divergence Fix 12/26 | ✅ |
| MAMA | MESA Adaptive Moving Average | 🔜 |
| MINUS_DI | Minus Directional Indicator | ✅ |
| MINUS_DM | Minus Directional Movement | 🔜 |
| PLUS_DI | Plus Directional Indicator | ✅ |
| PLUS_DM | Plus Directional Movement | 🔜 |
| SAR | Parabolic SAR | 🔜 |
| SAREXT | Parabolic SAR — Extended | 🔜 |
| SMA | Simple Moving Average | ✅ |
| T3 | Triple Exponential Moving Average (T3) | ✅ |
| TEMA | Triple Exponential Moving Average | ✅ |
| TRIMA | Triangular Moving Average | ✅ |
| TRIX | 1-day Rate-Of-Change of a Triple Smooth EMA | 🔜 |
| TSF | Time Series Forecast | ✅ |
| WMA | Weighted Moving Average | ✅ |
Momentum
| Code | Indicator | Strategy |
|---|---|---|
| BOP | Balance Of Power | 🔜 |
| CCI | Commodity Channel Index | 🔜 |
| CMO | Chande Momentum Oscillator | 🔜 |
| MOM | Momentum | 🔜 |
| PPO | Percentage Price Oscillator | 🔜 |
| ROC | Rate of Change | 🔜 |
| ROCP | Rate of Change Percentage | 🔜 |
| ROCR | Rate of Change Ratio | 🔜 |
| ROCR100 | Rate of Change Ratio 100 Scale | 🔜 |
| RSI | Relative Strength Index | ✅ |
| STOCH | Stochastic | ✅ |
| STOCHF | Stochastic Fast | ✅ |
| STOCHRSI | Stochastic Relative Strength Index | ✅ |
| ULTOSC | Ultimate Oscillator | 🔜 |
| WILLR | Williams' %R | 🔜 |
Volatility
| Code | Indicator | Strategy |
|---|---|---|
| ATR | Average True Range | ✅ |
| BBANDS | Bollinger Bands (Upper / Lower available separately) | ✅ |
| NATR | Normalized Average True Range | 🔜 |
| STDDEV | Standard Deviation | 🔜 |
| TRANGE | True Range | 🔜 |
| VAR | Variance | 🔜 |
Volume
| Code | Indicator | Strategy |
|---|---|---|
| AD | Chaikin A/D Line | 🔜 |
| ADOSC | Chaikin A/D Oscillator | 🔜 |
| MFI | Money Flow Index | 🔜 |
| OBV | On Balance Volume | ✅ |
Price-Derived
| Code | Indicator | Strategy |
|---|---|---|
| AVGPRICE | Average Price | ✅ |
| LINEARREG | Linear Regression | ✅ |
| LINEARREG_ANGLE | Linear Regression Angle | 🔜 |
| LINEARREG_INTERCEPT | Linear Regression Intercept | 🔜 |
| LINEARREG_SLOPE | Linear Regression Slope | 🔜 |
| MAX | Highest value over a specified period | 🔜 |
| MAXINDEX | Index of highest value over a specified period | 🔜 |
| MEDPRICE | Median Price | 🔜 |
| MIDPOINT | MidPoint over period | 🔜 |
| MIDPRICE | Midpoint Price over period | 🔜 |
| MIN | Lowest value over a specified period | 🔜 |
| MININDEX | Index of lowest value over a specified period | 🔜 |
| MINMAX | Lowest and highest values over a specified period | 🔜 |
| MINMAXINDEX | Indexes of lowest and highest values | 🔜 |
| SUM | Summation | 🔜 |
| TYPPRICE | Typical Price | ✅ |
| WCLPRICE | Weighted Close Price | ✅ |
Complete Indicator List
| Code | Indicator | Strategy |
|---|---|---|
| AD | Chaikin A/D Line | 🔜 |
| ADOSC | Chaikin A/D Oscillator | 🔜 |
| ADX | Average Directional Movement Index | ✅ |
| ADXR | Average Directional Movement Index Rating | 🔜 |
| APO | Absolute Price Oscillator | 🔜 |
| AROON | Aroon | ✅ |
| AROONOSC | Aroon Oscillator | ✅ |
| ATR | Average True Range | ✅ |
| AVGPRICE | Average Price | ✅ |
| BBANDS | Bollinger Bands (Upper / Lower available separately) | ✅ |
| BOP | Balance Of Power | 🔜 |
| CCI | Commodity Channel Index | 🔜 |
| CMO | Chande Momentum Oscillator | 🔜 |
| DEMA | Double Exponential Moving Average | ✅ |
| DX | Directional Movement Index | 🔜 |
| EMA | Exponential Moving Average | ✅ |
| HT_DCPERIOD | Hilbert Transform — Dominant Cycle Period | 🔜 |
| HT_DCPHASE | Hilbert Transform — Dominant Cycle Phase | 🔜 |
| HT_PHASOR | Hilbert Transform — Phasor Components | 🔜 |
| HT_SINE | Hilbert Transform — SineWave | 🔜 |
| HT_TRENDLINE | Hilbert Transform — Instantaneous Trendline | ✅ |
| HT_TRENDMODE | Hilbert Transform — Trend vs Cycle Mode | 🔜 |
| KAMA | Kaufman Adaptive Moving Average | ✅ |
| LINEARREG | Linear Regression | ✅ |
| LINEARREG_ANGLE | Linear Regression Angle | 🔜 |
| LINEARREG_INTERCEPT | Linear Regression Intercept | 🔜 |
| LINEARREG_SLOPE | Linear Regression Slope | 🔜 |
| MA | All Moving Average | ✅ |
| MACD | Moving Average Convergence/Divergence | ✅ |
| MACDEXT | MACD with controllable MA type | 🔜 |
| MACDFIX | Moving Average Convergence/Divergence Fix 12/26 | ✅ |
| MAMA | MESA Adaptive Moving Average | 🔜 |
| MAX | Highest value over a specified period | 🔜 |
| MAXINDEX | Index of highest value over a specified period | 🔜 |
| MEDPRICE | Median Price | 🔜 |
| MFI | Money Flow Index | 🔜 |
| MIDPOINT | MidPoint over period | 🔜 |
| MIDPRICE | Midpoint Price over period | 🔜 |
| MIN | Lowest value over a specified period | 🔜 |
| MININDEX | Index of lowest value over a specified period | 🔜 |
| MINMAX | Lowest and highest values over a specified period | 🔜 |
| MINMAXINDEX | Indexes of lowest and highest values over a specified period | 🔜 |
| MINUS_DI | Minus Directional Indicator | ✅ |
| MINUS_DM | Minus Directional Movement | 🔜 |
| MOM | Momentum | 🔜 |
| NATR | Normalized Average True Range | 🔜 |
| OBV | On Balance Volume | ✅ |
| PLUS_DI | Plus Directional Indicator | ✅ |
| PLUS_DM | Plus Directional Movement | 🔜 |
| PPO | Percentage Price Oscillator | 🔜 |
| ROC | Rate of Change | 🔜 |
| ROCP | Rate of Change Percentage | 🔜 |
| ROCR | Rate of Change Ratio | 🔜 |
| ROCR100 | Rate of Change Ratio 100 Scale | 🔜 |
| RSI | Relative Strength Index | ✅ |
| SAR | Parabolic SAR | 🔜 |
| SAREXT | Parabolic SAR — Extended | 🔜 |
| SMA | Simple Moving Average | ✅ |
| STDDEV | Standard Deviation | 🔜 |
| STOCH | Stochastic | ✅ |
| STOCHF | Stochastic Fast | ✅ |
| STOCHRSI | Stochastic Relative Strength Index | ✅ |
| SUM | Summation | 🔜 |
| T3 | Triple Exponential Moving Average (T3) | ✅ |
| TEMA | Triple Exponential Moving Average | ✅ |
| TRANGE | True Range | 🔜 |
| TRIMA | Triangular Moving Average | ✅ |
| TRIX | 1-day Rate-Of-Change of a Triple Smooth EMA | 🔜 |
| TSF | Time Series Forecast | ✅ |
| TYPPRICE | Typical Price | ✅ |
| ULTOSC | Ultimate Oscillator | 🔜 |
| VAR | Variance | 🔜 |
| WCLPRICE | Weighted Close Price | ✅ |
| WILLR | Williams' %R | 🔜 |
| WMA | Weighted Moving Average | ✅ |
When you select an indicator from the list, set its parameters, and click Apply, it draws on the candle chart. Each applied indicator appears with an eye icon to toggle its visibility on or off.
How to Interpret It
Indicator Selection for Strategy Building
Use the category tables above to identify indicators suited to your strategy type. Trend indicators (ADX, EMA, MACD, AROON) work well for directional strategies. Momentum indicators (RSI, STOCH, STOCHRSI) suit mean-reversion and overbought/oversold setups. Volatility indicators (BBANDS) help define dynamic entry and exit levels. Volume indicators (OBV) provide confirmation signals based on market participation. Price-derived indicators (LINEARREG, AVGPRICE) are useful as signal inputs or comparison baselines.
Example
You want to build a trend-following strategy with volatility filtering:
- Select ADX from the indicator list. Set the period to 14 and click Apply. The ADX line draws on the chart — you plan to only take trades when ADX is above 25, indicating a meaningful trend.
- Select EMA, set the period to 50, and click Apply. Then select EMA again, set the period to 200, and click Apply. Both EMA lines now appear on the chart side by side — the crossover of the 50 over the 200 defines your trend direction.
- Select ATR, set the period to 14, and click Apply. Use the ATR value to inform dynamic stop-loss distances that adjust to current market conditions.
- Select OBV and click Apply. Use its slope as a confirmation filter — enter only when volume flow agrees with the trend direction.
This four-indicator setup spans trend, moving averages, volatility, and volume — each contributing a distinct dimension of analysis. All four are visible on the chart simultaneously, and you can toggle any of them on or off with the eye icon.