Latency Distribution
What it is
Latency here refers specifically to signal delivery time — the time from when Strateda generates the trade signal to when it arrives at your MT5 terminal. Broker order execution time (from MT5 receipt to broker fill confirmation) is a separate measurement and is not included in this chart.
The Latency Distribution view shows signal delivery time (in milliseconds) across all your live trades as a histogram with a KDE overlay. Understanding your signal delivery profile matters because it affects how closely your live fills match the prices at signal generation — though slippage itself is determined by broker execution, not signal delivery speed.
For algorithmic strategies running on intraday timeframes, signal delivery latency is particularly relevant. A strategy that generates signals on M15 or M30 data may not be sensitive to 100ms differences, but a strategy on M1 or M5 candles benefits from faster signal delivery. Consistently high signal latency may indicate a suboptimal server region selection.
How to access it
Navigate to Latency Distribution in the Execution Quality dashboard. Available on Pro and Premium plans.
What you see
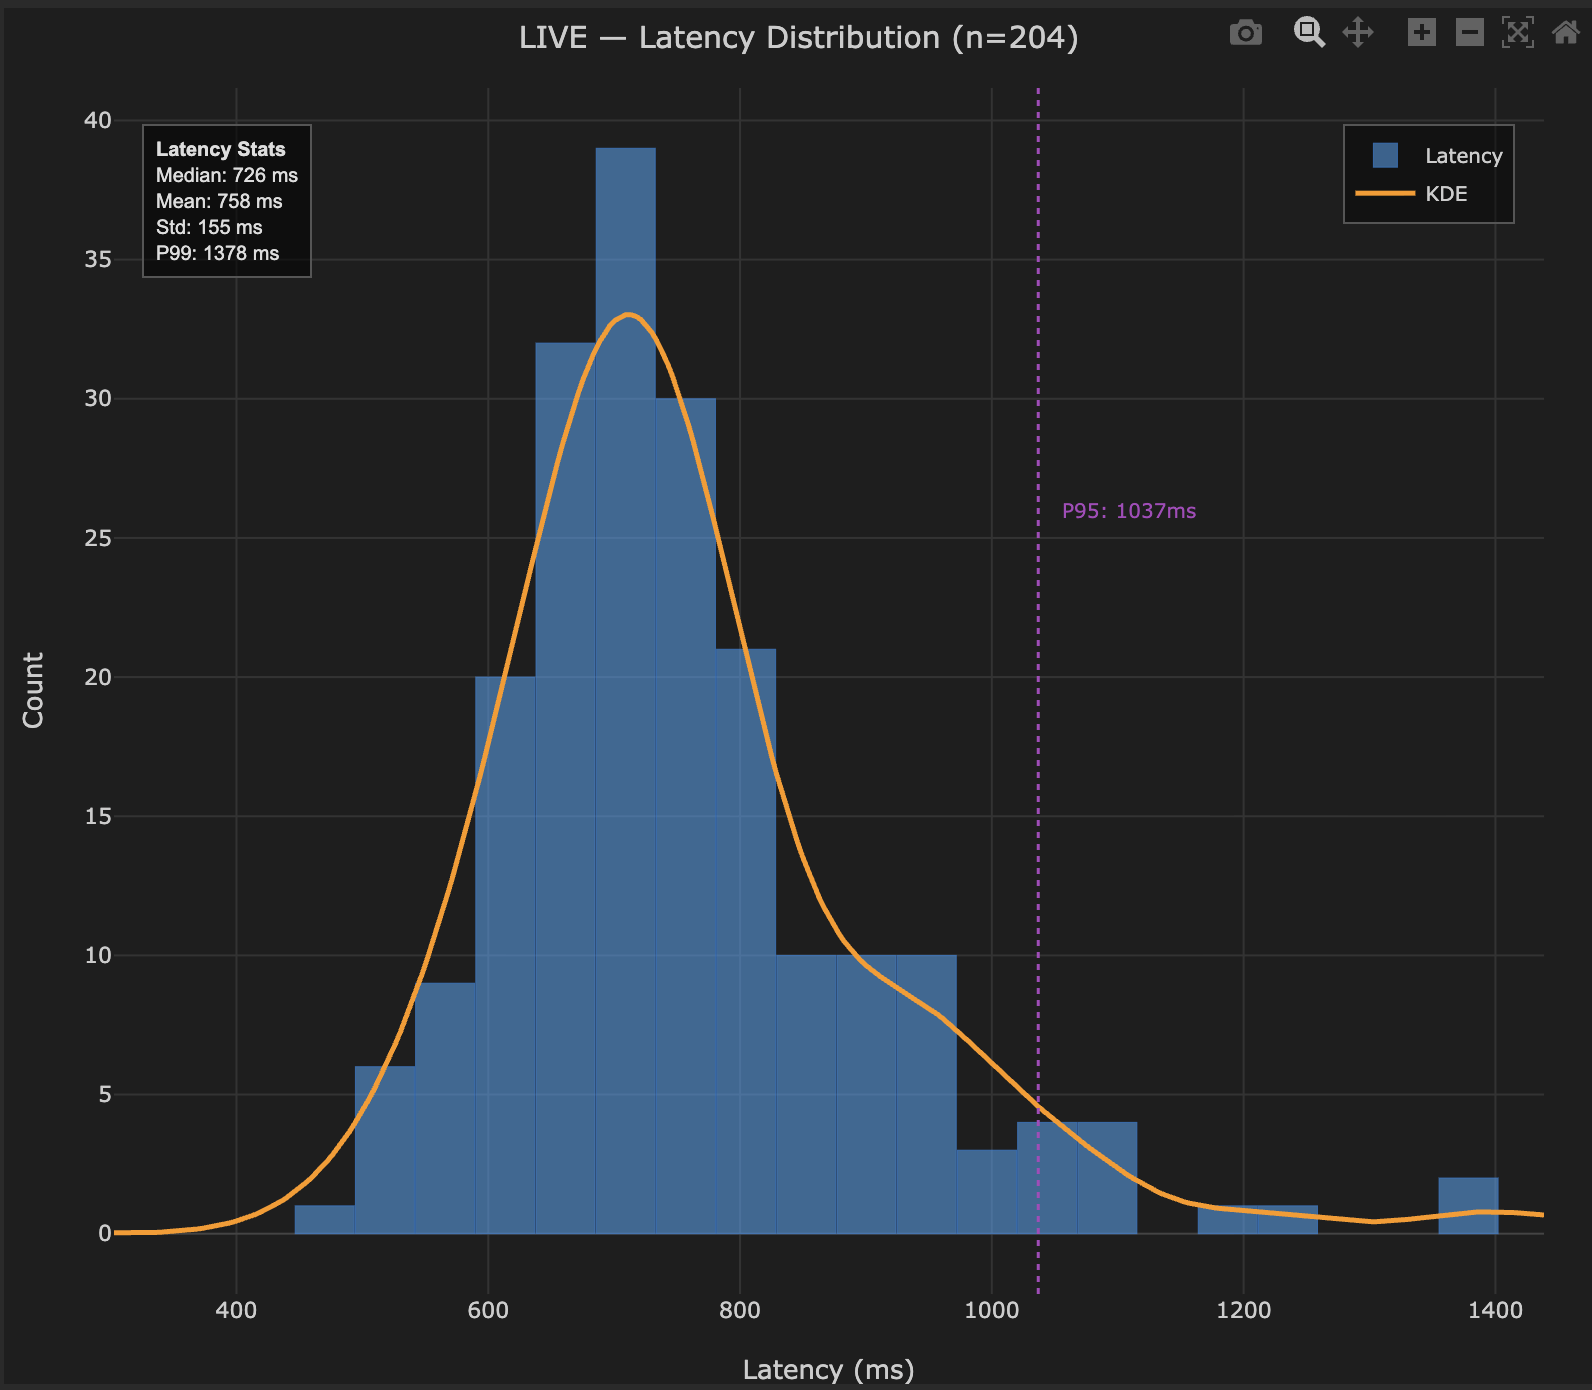
- X-axis — Latency in milliseconds.
- Y-axis — Frequency (number of trades).
- Histogram bars — Distribution of fill times across all trades.
- KDE curve — Smooth density estimate showing the underlying latency distribution.
- Stats box — Shows Median, Mean, Standard Deviation, and P99 for the full distribution.
- P95 marker — A dashed vertical line marking the 95th percentile signal delivery time — 1 in 20 signals takes at least this long to reach MT5.
How to interpret it
Distribution shape
Tight, right-skewed distribution (most fills fast, tail of slower fills): Normal and expected. Most orders fill quickly, with an occasional slow fill during high-activity periods. As long as the tail isn't extreme, this is typical broker behavior.
Wide distribution (high standard deviation): Inconsistent fill times. Some fills are fast, others take much longer. This creates unpredictable execution quality and makes it harder to rely on time-sensitive signals.
Bimodal distribution: Two distinct latency modes — possibly different server routes, different order types, or different market conditions. If you're using Strateda's dual-region MT5 servers (US East and EU Central), check whether the modes correspond to different server locations.
Heavy right tail (many signals > 1000ms): A significant portion of signals experience long delivery times. Investigate whether these correlate with higher slippage using the Latency vs Slippage view — though note that slippage is determined by broker execution, not signal delivery speed alone.
What the percentiles tell you
- Median — Your typical signal delivery time. This is what you should expect on a normal trade.
- P95 — Your realistic worst-case signal delivery time — 1 in 20 signals takes at least this long. Shown as a dashed vertical line on the chart.
- P99 — Extreme outlier threshold shown in the stats box. If significantly higher than P95, occasional severe delays exist.
Benchmark ranges
Latency depends on your chosen server region (US/EU), network conditions between Strateda and your MT5 terminal, and your geographic location. Select the server region closest to your MT5 terminal in the Strateda app bar for lowest signal delivery times.
| Latency | Assessment |
|---|---|
| Median < 500ms | Excellent — fast signal delivery |
| Median 500–700ms | Good — typical retail MT5 setup |
| Median 700–1000ms | Acceptable — consider switching server region |
| Median > 1000ms | High — switch to closer server region |
Example
Signal delivery latency distribution from 200 live trades on EURCHF via MT5 (EU server region):
- Median: 580ms
- P95 (dashed line): 1180ms
- P99 (stats box): 1420ms
Interpretation: The median of 580ms is within the "good" range for a typical retail MT5 setup. The 95th percentile of 1180ms means roughly 1 in 20 signals takes over a second to arrive — worth monitoring but not alarming for an M30 strategy where candle resolution is 30 minutes.
This latency represents signal delivery only — the time from Strateda's cloud server to the trader's MT5 terminal. Broker execution speed (from MT5 receipt to fill confirmation) is a separate factor and is not included in these numbers.
For this M30 strategy, the latency profile is acceptable — even the P99 of 1420ms has negligible impact on a 30-minute candle. If the trader were running an M1 strategy, the P95 values above 1000ms would warrant switching to a closer server region to reduce signal delivery times. Consistently high P95 values across multiple sessions suggest the current server region is suboptimal for the trader's geographic location.