Live Broker Margin Per Trade
What it is
Broker Margin Per Trade shows the margin required by your broker to open each position over time, expressed in both dollar terms and as a percentage of account balance. Margin is the collateral your broker holds — it is a fraction of total exposure determined by your broker's leverage settings. A 500 in margin; at 20:1, the same position requires $2,500.
Monitoring margin per trade reveals whether your broker's margin requirements are stable and whether your strategy is consuming a consistent proportion of your capital. If margin as a percentage of balance creeps upward, you are either drawing down or your broker has changed leverage terms — both situations that require attention before a margin call forces the issue.
How to access it
Navigate to Broker Margin in the live strategy analytics panel after loading your live trades. Available on Pro and Premium plans. You must first load your live strategy trades (see Loading Live Trades).
Live analytics are region-scoped — ensure the navbar region matches the region the strategy was started in. See Server Selection.
What you see
- X-axis — Time (UTC) — trades displayed in chronological order.
- Left Y-axis — Margin Required ($) — the dollar amount of collateral held by the broker for each trade.
- Right Y-axis — % of Balance — margin expressed as a percentage of your account balance at the time of the trade.
- Blue line — Margin required per trade in dollars, connecting each trade's margin value.
- Orange dashed line — Mean margin in dollars across all loaded trades.
- Orange dotted line — Mean margin as % of balance across all loaded trades.
- Title — Shows the mean dollar amount and mean percentage for quick reference.
How to interpret it
Margin patterns
Since Strateda sizes positions as a percentage of your current account balance, margin per trade will naturally fluctuate with your balance over time. A gradually drifting line is the expected pattern — not a flat line.
Gradual drift upward (dollar amount): Expected — strategy is profitable, balance growing, each trade's margin scales up proportionally. The margin % should remain stable even as dollar amounts increase.
Gradual drift downward (dollar amount): Expected — strategy in drawdown, balance declining, each trade's margin scales down proportionally — percentage-based sizing provides natural risk reduction during losing periods.
Rising margin %: Either your broker increased margin requirements (reduced leverage), or your account balance is declining while position sizes are not scaling down as expected. Both situations increase risk — check your account balance trend to distinguish between broker-side leverage changes and strategy configuration issues.
Falling margin %: Account balance is growing and the strategy is compounding. The falling margin % indicates increasing buffer between your positions and a margin call — a healthy sign of a profitable strategy running correctly.
Sudden jumps: A sharp spike in margin per trade warrants immediate investigation. Possible causes:
- Broker changed leverage or margin requirements for the instrument (common during high-volatility events or regulatory changes).
- A significantly larger position was opened due to a configuration error or unusual price at entry.
- Instrument-specific margin adjustments (brokers often increase margin requirements around major economic releases).
Margin call awareness
Compare your mean margin % to your broker's margin call level:
| Mean Margin % of Balance | Risk Level |
|---|---|
| < 10% | Conservative — large buffer to margin call |
| 10–25% | Moderate — comfortable for most strategies |
| 25–40% | Elevated — limited buffer, monitor closely |
| > 40% | High — close to margin call territory, reduce position sizes or add capital |
Remember that margin % shown here is per trade at the moment of opening. If your strategy holds multiple positions simultaneously, total margin usage is the sum across all open positions — which can be significantly higher than the per-trade figure.
Example
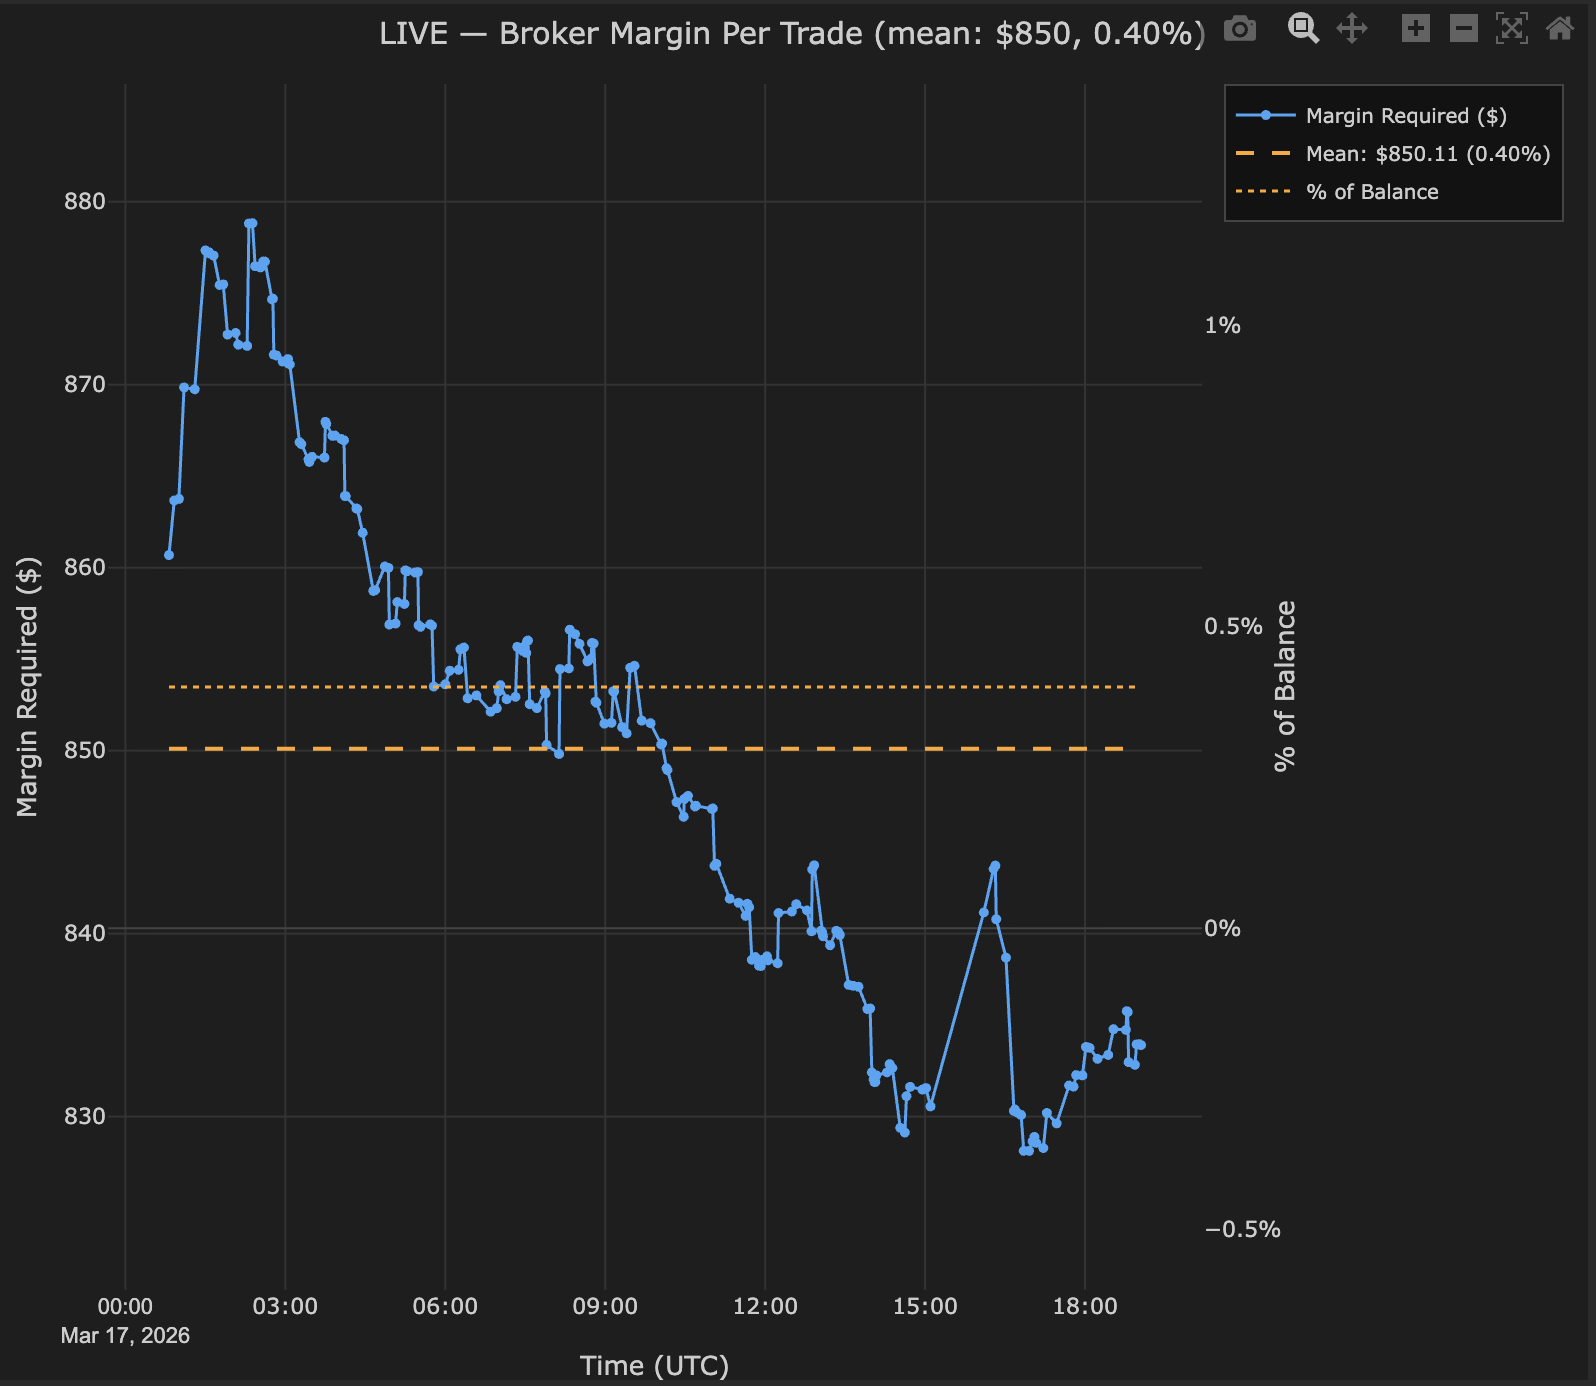
Broker Margin for a BTCUSD live strategy over 3 months:
- Mean margin: $850 (orange dashed line).
- Mean margin %: 0.40% of balance (orange dotted line).
- Pattern: Margin in dollars drifts gradually in line with account balance changes — consistent with percentage-of-balance sizing working as configured.
- Margin %: Remains stable throughout — position sizing is scaling proportionally with the account.
- No sudden jumps — broker leverage has remained constant for this instrument.
Interpretation: At 0.40% mean margin per trade, the strategy has substantial buffer to the margin call level. The stable margin % confirms that percentage-based sizing is working as intended, with position sizes adjusting proportionally as the account balance changes.