Live vs Backtest Comparison
What it is
The most important question in algorithmic trading is whether your backtest accurately models real execution. Most platforms leave you guessing. Strateda answers it directly by letting you run a backtest over the exact same period as your live trades and compare the two equity curves side by side.
If the curves match closely, your backtest is a reliable model. If they diverge significantly, your broker's execution costs, slippage, or spread conditions differ from your backtest assumptions — and you need to adjust before scaling up. This comparison closes the loop between theoretical performance and real-world results, turning "I think my strategy works" into "I can measure exactly how my live execution compares to my model."
How to access it
This comparison is available on Pro and Premium plans — the same plans that support live trading. You need an active or historical live strategy with trades executed through the Strateda EA, and enough data to run a meaningful backtest over the same period.
What you see
Running the comparison
- Load your live strategy — Click the arrow icon on your live strategy in the Stored Strategy List. The red live equity curve appears in the View Panel (see Loading Live Trades for details).
- Set a custom time range (optional) — To focus on a specific period, set the start and end date inputs in the strategy builder, then click the arrow again to reload. This is useful for isolating volatile periods or recent performance.
- Press Run — A backtest executes automatically with the identical starting balance and the same time range as the loaded live trades. No additional configuration is needed — the platform uses the same strategy parameters.
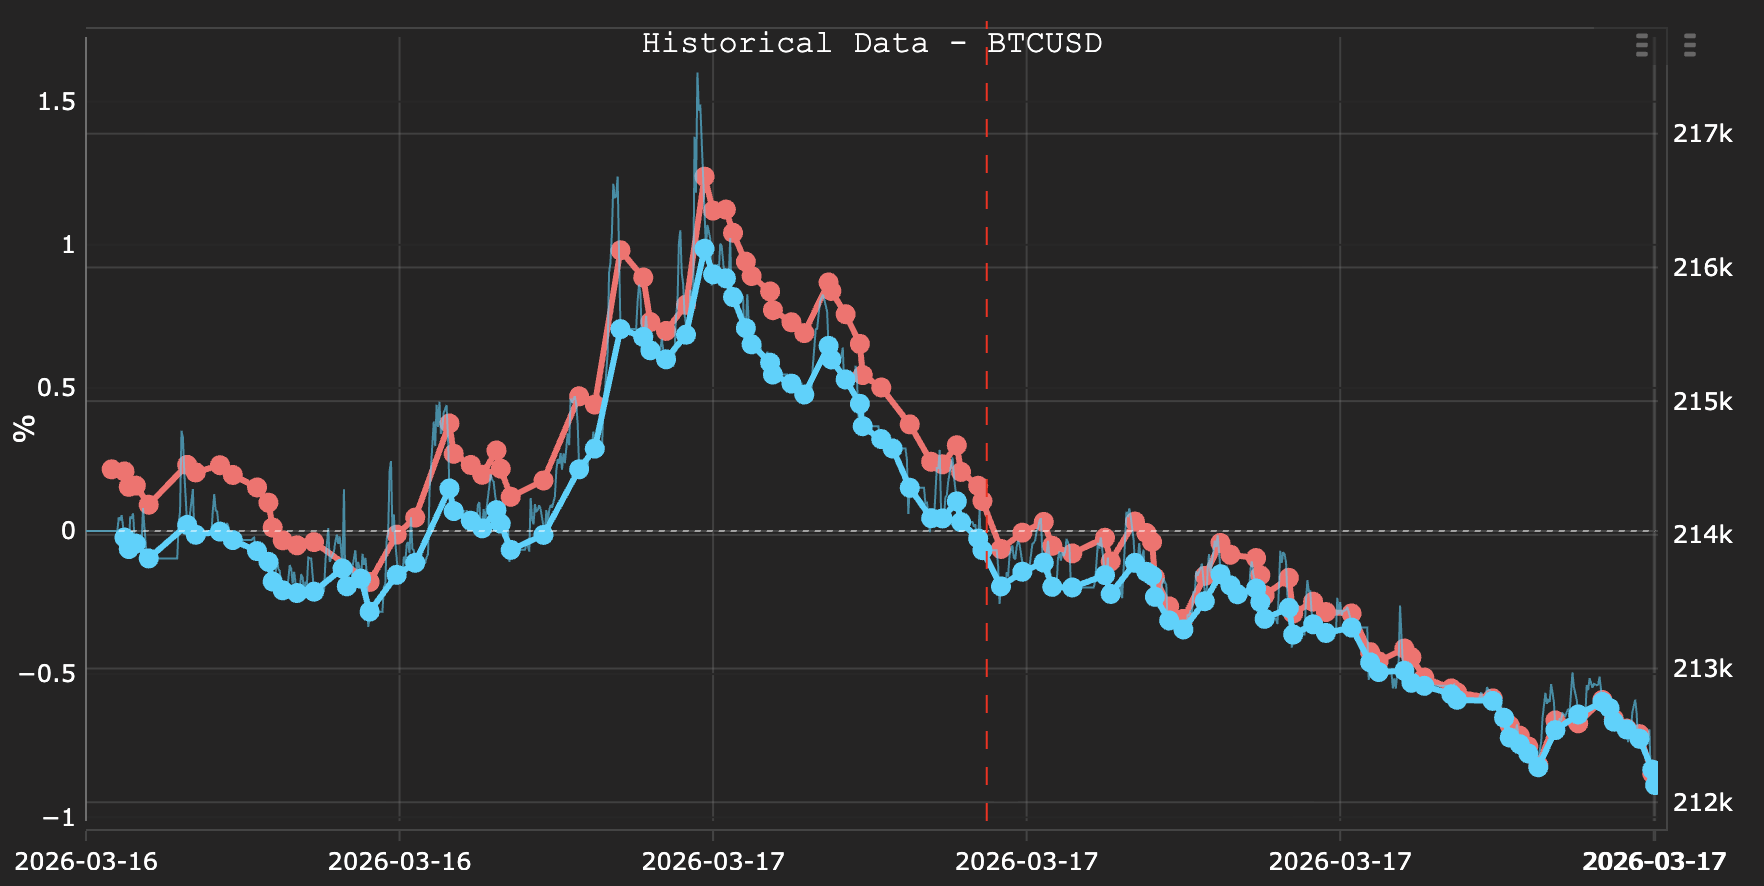
- Blue backtest curve appears — The backtest equity curve is added to the View Panel in blue alongside the red live curve. Both curves are now visible on the chart simultaneously.
Navigating the comparison
- Eye icons — Toggle visibility of each curve independently. Hide the backtest to focus on live performance, or hide the live curve to examine the theoretical path.
- Heartbeat icon — Click on either curve to bring it into focus. The chart axes re-centre on that curve and the unrealised P&L path becomes active, showing intra-trade equity movement.
- Global table icon — Click the table icon at the bottom of the View Panel to open the comparison metrics table showing both curves side by side.
The comparison metrics table
The global table icon opens a side-by-side metrics comparison for the live and backtest curves over the same period:
| Metric | What it shows |
|---|---|
| Return % | Total return over the comparison period |
| Volatility | Standard deviation of returns |
| Max Drawdown | Largest peak-to-trough decline |
| Sharpe Ratio | Risk-adjusted return |
| Calmar Ratio | Return relative to maximum drawdown |
| Win % | Percentage of trades that closed profitably |
| Profit Factor | Gross profit divided by gross loss |
| Win/Loss Ratio | Average winning trade size relative to average losing trade |
| Streak | Longest consecutive winning and losing streaks |
| Trades | Total number of trades in the period |
| Hold Time | Average time positions were held |
| Market % | Percentage of the period spent in a position |
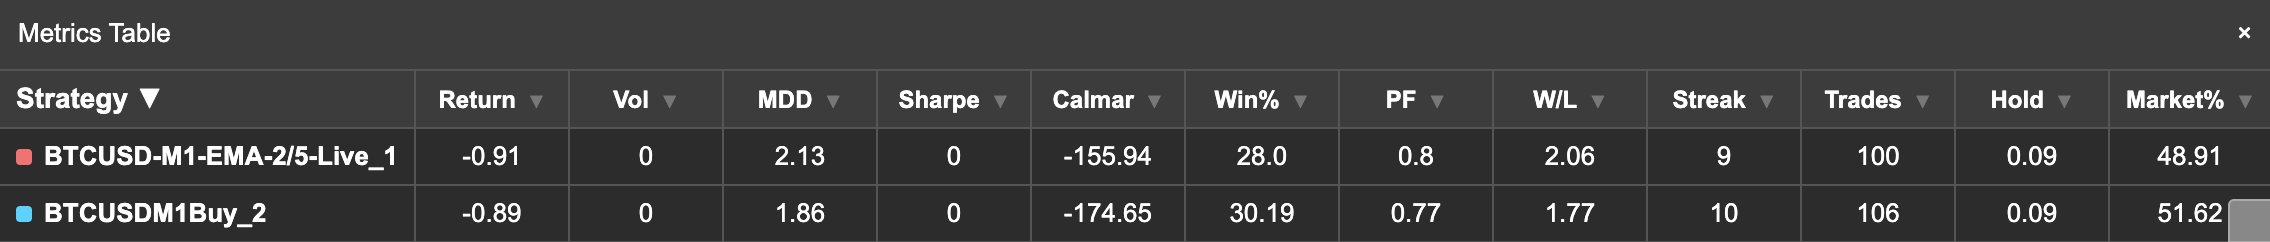
The metrics should be read as pairs. A Sharpe of 1.2 (backtest) vs 0.9 (live) tells you that execution costs eroded about 25% of risk-adjusted performance — quantifiable and actionable.
How to interpret it
Reading the curve relationship
- Curves match closely — Your backtest is a reliable model of live execution. Broker conditions (spread, commission, slippage) are well-represented in your backtest settings. This is the ideal outcome and gives you confidence to scale position sizes.
- Live curve consistently below backtest — Real execution costs are higher than modelled. This is the most common pattern. Check your MT5 backtesting spread and commission settings — they likely underestimate your broker's actual costs. The gap between the curves quantifies exactly how much execution costs are eroding your edge.
- Live curve diverges at specific periods — Possible broker liquidity issues or news events affecting execution quality during those windows. Use a custom time range to isolate the divergent period and cross-reference with the Temporal Slippage Patterns heatmap to identify whether the divergence correlates with specific trading hours.
- Live curve above backtest — Positive slippage: your broker executed at better prices than the backtest assumed. This is rare but possible with limit orders or during periods of unusually deep liquidity. Verify this is genuine rather than a data artefact before relying on it.
Significant divergence between live and backtest curves does not necessarily mean your strategy is failing — it may mean your backtest assumptions need calibrating to match your broker's actual execution costs.
Recommended workflow
- Always run this comparison on a demo account first before committing real capital. Demo accounts validate execution quality with zero risk.
- If curves diverge more than 10–15%, review your MT5 backtesting commission and spread settings. Adjust the Execution Cost Multiplier in the EA configuration until the backtest curve approximates the live curve.
- Use custom time ranges to isolate specific market conditions — volatile periods (earnings, central bank announcements, low-liquidity sessions) often show more divergence than calm periods. Understanding when the model breaks helps you decide whether to restrict trading hours.
- The more trades in the comparison period, the more statistically meaningful the result. A comparison over 10 trades is anecdotal. A comparison over 100+ trades reveals systematic patterns in execution quality.
Why demo account testing matters
Running a strategy on a demo account and comparing to backtest is the most reliable way to validate execution quality before risking real capital. Most brokers provide demo accounts with spreads and commissions that match live conditions — making this comparison a true pre-live validation step.
The workflow is: backtest → optimize → validate with WFO → deploy on demo → compare live vs backtest → adjust execution assumptions → deploy on live. Skipping the demo comparison step means deploying with unvalidated execution assumptions — the most common source of disappointment when moving from backtesting to live trading.
Example
A trader has been running a DEMA/EMA crossover strategy on a demo account for 4 weeks, accumulating 64 trades on EURCHF M30:
- Opens Strateda and clicks the arrow icon on the live strategy — the last 64 trades load with the red equity curve showing +3.2% return.
- Clicks Run — the backtest executes over the same 4-week period. The blue curve appears showing +4.1% return.
- Opens the comparison metrics table: Live Sharpe 0.92 vs Backtest Sharpe 1.14. Live Max Drawdown -1.8% vs Backtest Max Drawdown -1.4%.
- The curves track closely for the first 3 weeks but diverge in week 4. The trader sets a custom range for week 4 only and re-runs.
- The isolated comparison reveals the divergence occurred during two Asian session trades where entry slippage was 0.8 pips vs the 0.2 pip backtest assumption.
- The trader increases the Execution Cost Multiplier from 0 to 20 in the EA settings and re-runs the full 4-week backtest. The new blue curve now matches the red live curve within 0.3% — confirming that the execution cost model is calibrated.
The strategy is now validated for live deployment with realistic execution assumptions. The trader knows exactly how much execution costs affect performance and has adjusted the model accordingly.