Rolling OOS Performance (Expanding Average)
What it is
Rolling OOS Performance tracks the expanding (cumulative) average of OOS metrics as each new window is added. Starting from Window 1, it shows how the average OOS return and average OOS profit factor evolve as more windows are completed. This view answers: "Is the overall forward-tested picture improving, deteriorating, or stabilizing as I add more data?"
How to access it
Navigate to the Rolling OOS tab in the WFO analytics popup. Available on Premium plans.
The WFO analytics popup is accessed via the table icon in the View Panel after your WFO job completes. See The Strategy Panel & View System for full details.
What you see
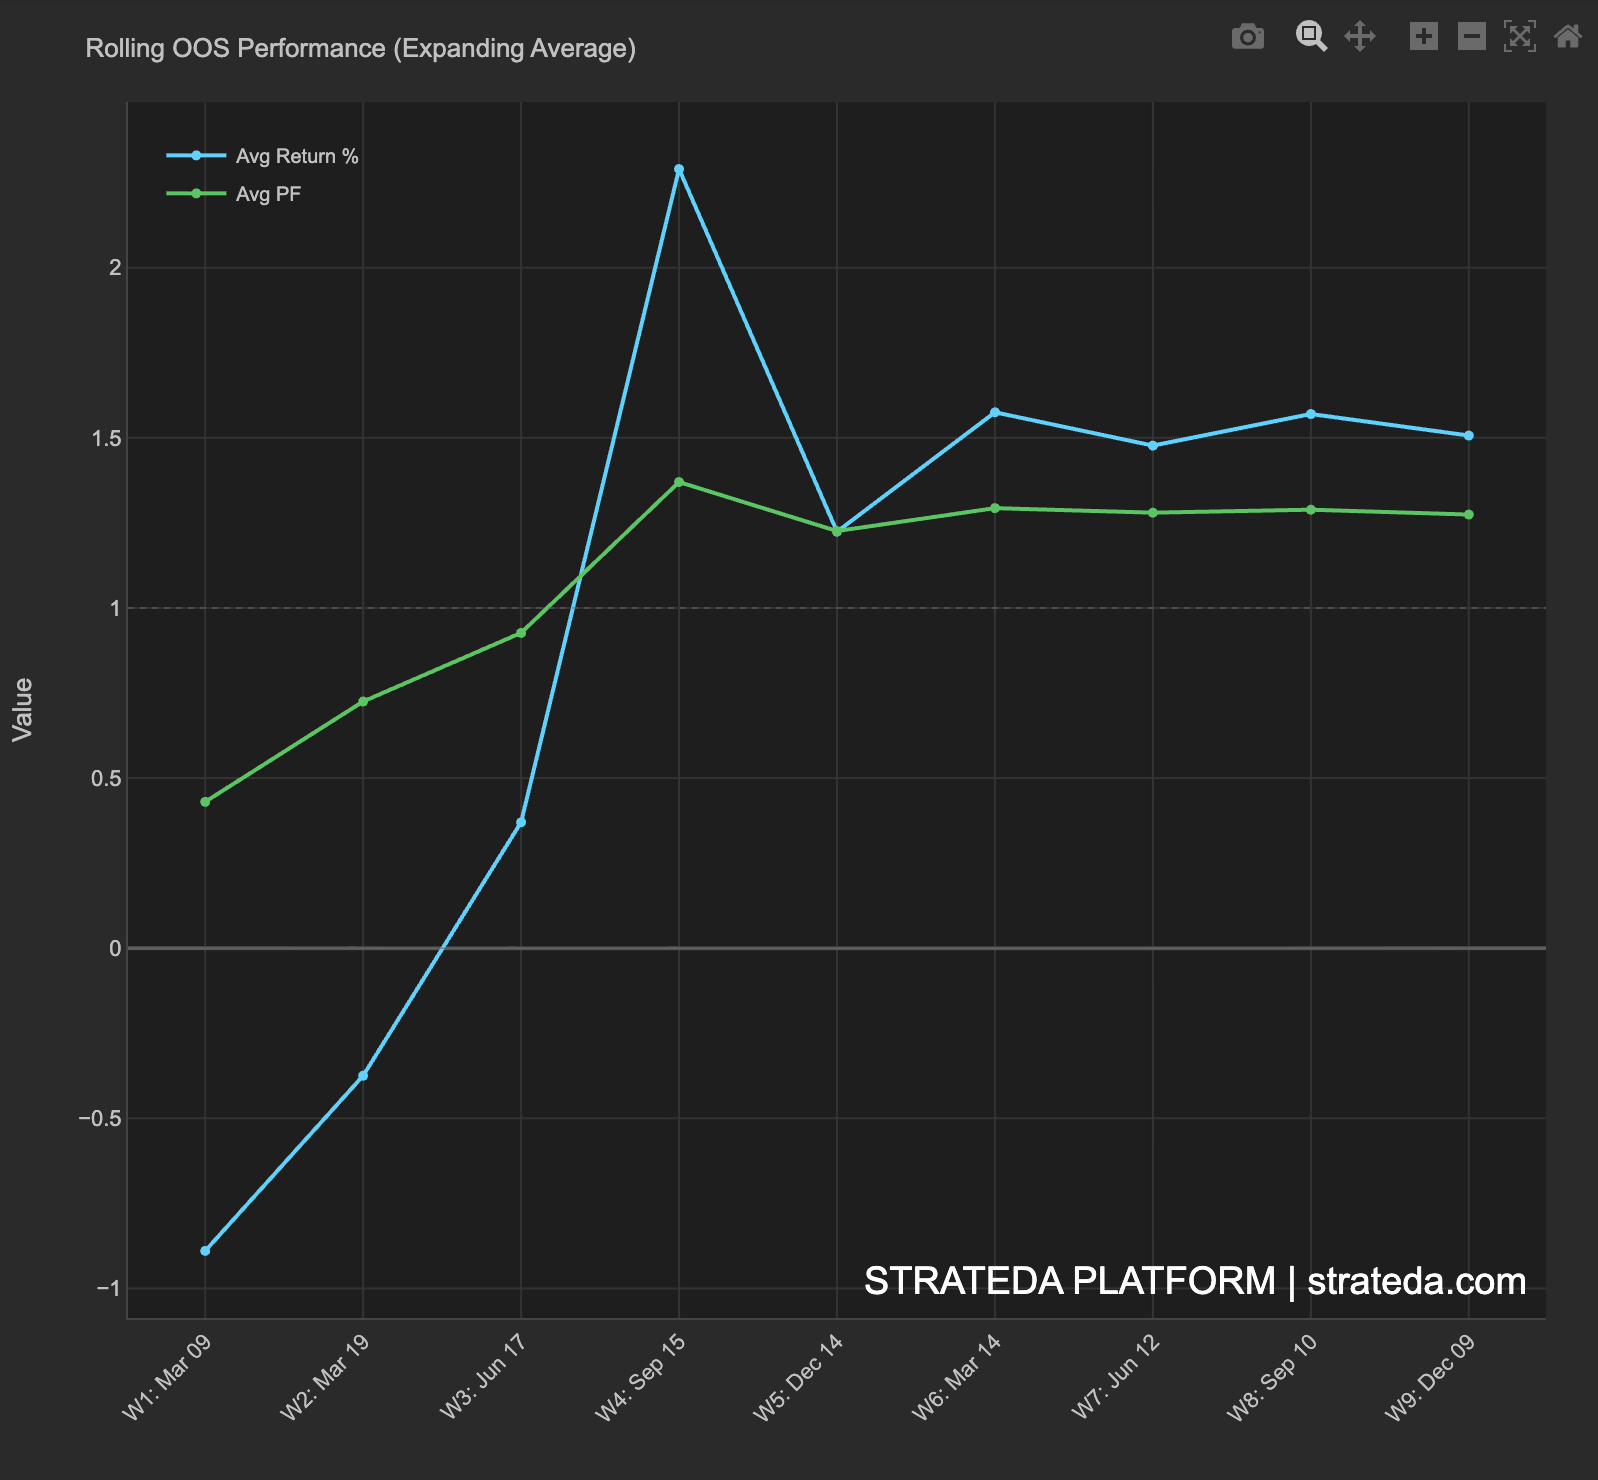
A single chart with two lines sharing a common Y-axis labeled "Value":
- Blue line (Avg Return %) — Expanding cumulative average of OOS return across windows. After Window 1, the average equals Window 1's return. After Window 2, it equals (W1 + W2) / 2. And so on.
- Green line (Avg PF) — Expanding cumulative average of OOS profit factor across windows.
- X-axis — Window labels in chronological order (W1: Mar 09, W2: Mar 19, etc.).
- Y-axis — Shared value axis for both metrics.
- Dashed reference line at y = 1.0 — the breakeven level for profit factor.
Both lines share the same axis, which means Return % and PF values are directly comparable visually. Both lines typically fluctuate more in the early windows (small sample size) and stabilize as more windows are added.
How to interpret it
Convergence
Lines stabilize and flatten: The averages have converged — adding more windows doesn't change the picture much. You have a reliable estimate of the strategy's forward performance. This is the ideal outcome.
Lines still moving after the last window: More windows would meaningfully change the averages. Your sample size may be too small for a confident assessment. Consider extending the data range to add more windows.
Direction
Average OOS return stays positive and above zero throughout: Every intermediate average is positive. Even after including occasional losing windows, the net forward performance is consistently positive. Strong validation.
Average dips below zero mid-sequence but recovers: A rough patch occurred but the strategy recovered. Acceptable if the dip corresponds to an identifiable regime and the recovery is genuine (not just one very large subsequent window).
Average trends downward: Each successive window makes the picture worse. The strategy may have worked early but the edge is decaying over time. Concerning for live deployment.
Starting below zero
The expanding average can start negative if the first window was a losing window. This is normal — early windows have the most volatile averages because the sample size is small. A single bad first window pulls the average deeply negative.
The key question is whether the average recovers and stabilizes above zero as more windows are added. An average that starts negative but recovers to a positive stable level by window 5+ is still a healthy WFO result. Only an average that remains negative or trends downward after 5+ windows is a genuine concern.
Stabilization point
Note where the averages stabilize. If they stabilize after 4–5 windows at a consistent level, the remaining windows confirm rather than change the picture. This tells you that 4–5 windows were sufficient for a reliable estimate — useful for future WFO configurations.
Example
Rolling OOS averages for a 9-window EMA crossover on EURCHF M30:
| After Window | Avg OOS Return | Avg OOS PF |
|---|---|---|
| W1 | −0.90% | 0.44 |
| W2 | −0.40% | 0.71 |
| W3 | +0.37% | 0.94 |
| W4 | +2.30% | 1.37 |
| W5 | +1.25% | 1.22 |
| W6 | +1.57% | 1.28 |
| W7 | +1.48% | 1.26 |
| W8 | +1.56% | 1.28 |
| W9 | +1.51% | 1.25 |
Interpretation: The average starts negative at W1 (−0.90% return, PF 0.44) because the first window was a losing period. This is a common pattern — a single bad first window pulls the expanding average deeply negative when the sample size is just one window.
The average recovers quickly: by W3 the return average crosses zero, and by W4 the strong +8.1% OOS window pulls both lines sharply upward. From W5 onwards, both lines stabilize — the return average settles around +1.5% and the PF average settles around 1.25. The last 5 windows barely move the averages, confirming the picture is reliable.
The final averages (+1.51% return, 1.25 PF) are both comfortably positive and above the breakeven reference line. Despite the negative start, the strategy demonstrates a genuine forward edge that stabilizes after sufficient windows.