WFO Parameter Table
What it is
The WFO Parameter Table is the core reference for every walk-forward run. It shows, for each window, which parameters the optimizer selected during the in-sample period and how those parameters performed during the out-of-sample period. This is the raw data underlying all other WFO analytics views.
How to access it
Navigate to the Parameter Table tab in the WFO analytics popup. Available on Premium plans.
The WFO analytics popup is accessed via the table icon in the View Panel after your WFO job completes. See The Strategy Panel & View System for full details.
What you see
A structured table with one row per WFO window, containing:
| Column | Description |
|---|---|
| Window | Sequential window number (W1, W2, W3, ...) |
| Trade Period | The out-of-sample date range for this window — the period where selected parameters were tested on unseen data |
| Parameter columns | One column per optimized parameter showing the value selected by the optimizer (e.g., EMA period fast, EMA period slow). Column names match your strategy's parameter names. |
| Return% | OOS total return for this window — color coded green for positive, red for negative |
| Trades | Number of trades executed during the OOS period |
The table shows the OOS trade period only — not separate IS and OOS date columns. The IS period immediately precedes each Trade Period window.
Each row represents one complete cycle: optimize on IS data → select best parameters → test on OOS data → record results.
How to interpret it
Parameter consistency
Read the "Selected Parameters" column top to bottom. This is one of the most important things to check:
- Consistent parameters — Values stay in a narrow range across windows (e.g., EMA stays between 25–35). The optimizer is finding the same signal each time — strong evidence of a real market pattern.
- Drifting parameters — Values shift gradually over time (e.g., EMA increases from 20 to 40 over successive windows). This may indicate a changing market regime — the strategy adapts, but you should understand why.
- Random parameters — Values jump erratically with no pattern (e.g., EMA 10, 55, 25, 60, 15). The optimizer is chasing noise each window. This is a strong overfitting signal.
OOS trade count
Check that each window has enough trades for meaningful results:
- 100+ trades — Sharpe ratio is statistically interpretable. Results are reliable.
- 30–99 trades — Directional signal only. The result tells you something, but don't over-interpret the exact Sharpe.
- Fewer than 30 trades — Below the Central Limit Theorem minimum. Results are indistinguishable from random.
OOS return pattern
Look at the sequence of OOS returns across windows:
- Mostly positive — Edge persists across time periods.
- Alternating positive/negative — Possible regime dependency. Check if losing windows correspond to identifiable market conditions.
- Early positive, later negative (or vice versa) — The market may have changed structurally.
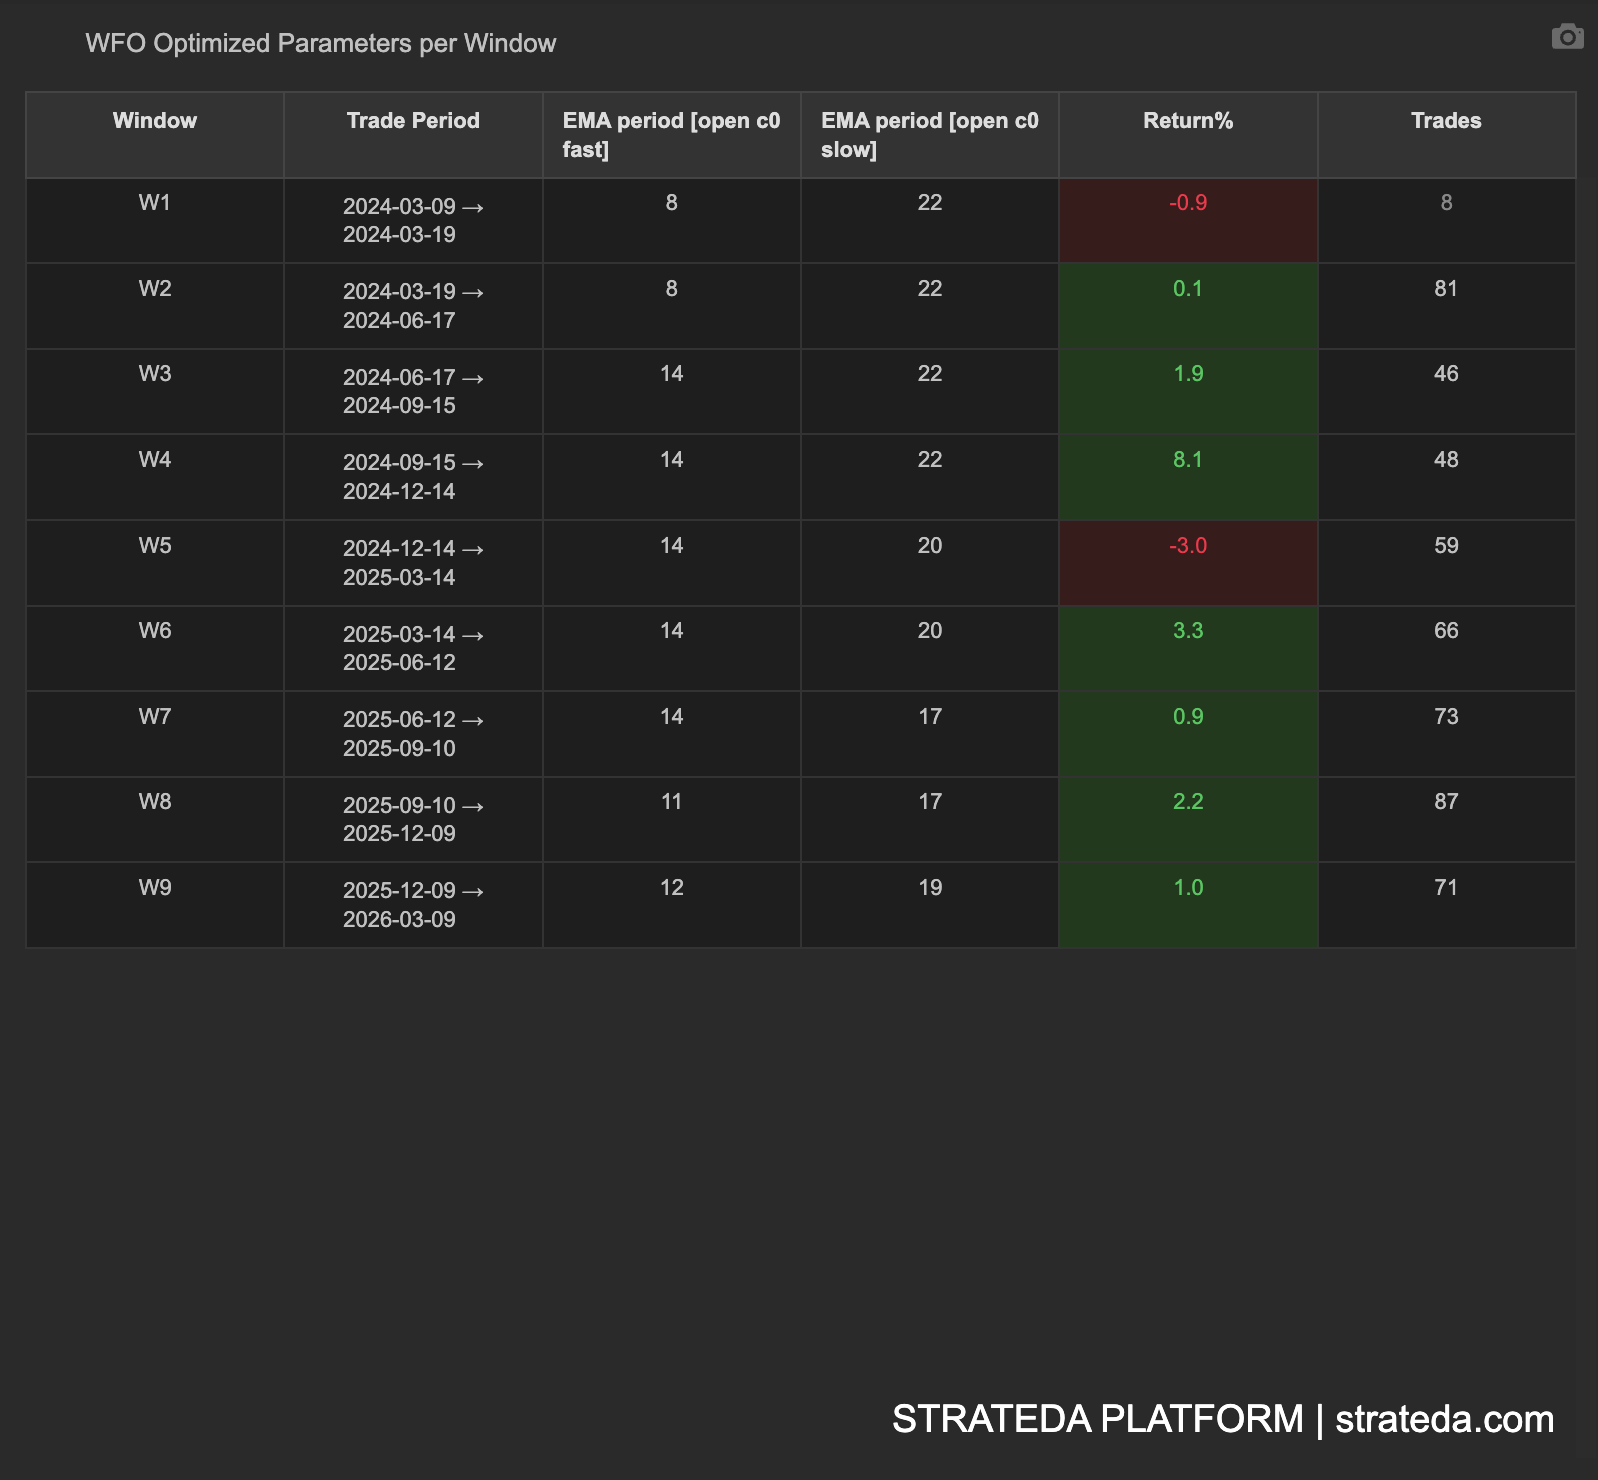
Example
A 9-window WFO for an EMA crossover on EURCHF M30:
| Window | Trade Period | EMA fast | EMA slow | Return% | Trades |
|---|---|---|---|---|---|
| W1 | Jan–Jun 2022 | 8 | 22 | −0.9% | 8 |
| W2 | Jul–Dec 2022 | 8 | 22 | +0.1% | 81 |
| W3 | Jan–Jun 2023 | 14 | 22 | +1.9% | 46 |
| W4 | Jul–Dec 2023 | 14 | 22 | +8.1% | 48 |
| W5 | Jan–Jun 2024 | 14 | 20 | −3.0% | 59 |
| W6 | Jul–Dec 2024 | 14 | 20 | +3.3% | 66 |
| W7 | Jan–Jun 2025 | 14 | 17 | +0.9% | 73 |
| W8 | Jul–Dec 2025 | 11 | 17 | +2.2% | 87 |
| W9 | Jan–Jun 2026 | 12 | 19 | +1.0% | 71 |
Reading this table: EMA fast stabilises around 11–14 from W3 onwards, with EMA slow drifting from 22 down to 17–19 — a gradual shift suggesting the optimal slow period is shortening over time. 7 of 9 OOS windows are profitable. W4 (+8.1%) is the standout winner; W5 (−3.0%) is the worst loss.
Important: W1 produced only 8 trades — well below the 30-trade minimum for statistical reliability. Its −0.9% return should be treated as a directional signal only, not a definitive measure of strategy quality for that period. Windows W3–W9 all have 46+ trades, providing more meaningful results.