Top-N Combinations Ranking
What it is
The Top-N Combinations Ranking shows the best-performing parameter sets from your optimization, ranked by your chosen metric (typically Sharpe ratio), with additional metrics displayed alongside for comparison. This view answers the practical question: "What are my best options, and how do they compare on other dimensions?"
While heatmaps and surfaces show the full landscape, this view focuses on the shortlist — the combinations you'd actually consider using. Seeing Sharpe, profit factor, and total return side by side for the top results helps you make a final selection that balances multiple criteria.
How to access it
Navigate to the Top N tab in the optimization analytics popup. Available on Plus plans and above.
The optimization analytics popup is accessed via the table icon in the View Panel after your optimization job completes. See The Strategy Panel & View System for full details.
What you see
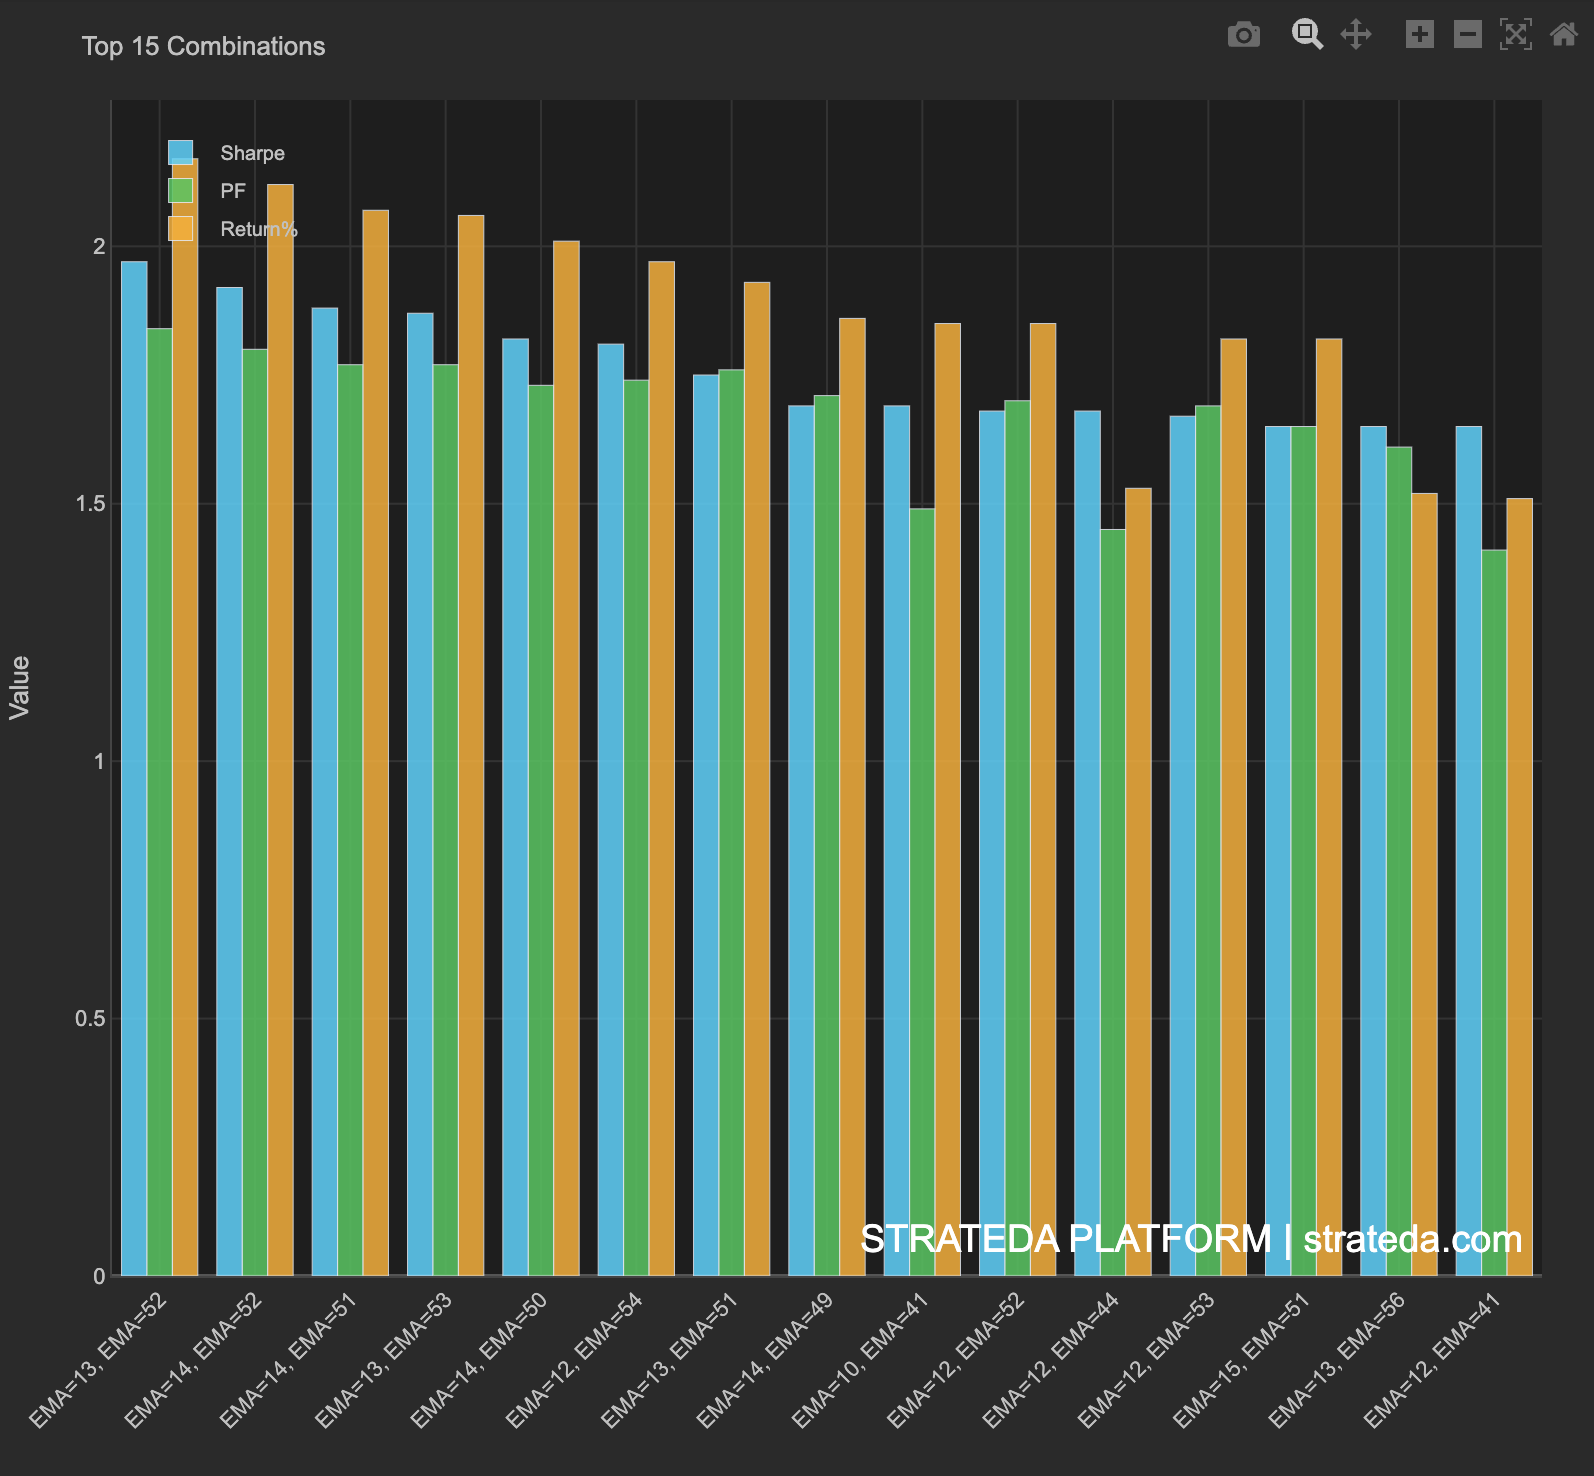
A multi-metric bar chart displaying the top N parameter combinations:
- Each group represents one parameter combination, labeled with its specific parameter values (e.g., "EMA 35 / DEMA 15").
- Bars within each group show different performance metrics side by side — typically Sharpe ratio, profit factor, and total return (%).
- Combinations are ordered from best to worst by the primary ranking metric.
- The chart makes it immediately visible when the "best" combination by Sharpe might not be the best by profit factor or return, and vice versa.
How to interpret it
Consistent top performer: If one combination ranks near the top across all three metrics (Sharpe, profit factor, return), it's a strong candidate. Consistent multi-metric performance is more trustworthy than excelling on a single measure.
Divergent rankings: If the top Sharpe combination has mediocre return, or the highest-return combination has a low profit factor, you need to decide which metric matters most for your trading goals:
- Prioritize Sharpe if you want stable, risk-adjusted performance and plan to compound over time.
- Prioritize profit factor if you care about consistency — how much you win relative to how much you lose per trade.
- Prioritize return if you're focused on absolute performance, but be cautious — high-return combinations often carry more risk.
Check the gap between #1 and #2:
- Large gap — The best combination is an outlier. Cross-check with the robustness analysis. If its neighbors score much lower, the result may be overfitting.
- Small gap — Multiple combinations perform similarly. Good sign. Any of the top group would be a reasonable choice, giving you flexibility.
Minimum viable trades: Always check that top-ranked combinations have enough trades to be statistically meaningful. A combination with a Sharpe of 2.5 from 8 trades is far less reliable than a Sharpe of 1.2 from 85 trades.
Example
Top-5 combinations from a DEMA × EMA optimization on AAPL:
| Rank | Parameters | Sharpe | Profit Factor | Return (%) |
|---|---|---|---|---|
| 1 | EMA 35 / DEMA 15 | 1.82 | 2.1 | +7.99% |
| 2 | EMA 30 / DEMA 20 | 1.71 | 2.3 | +7.12% |
| 3 | EMA 30 / DEMA 15 | 1.68 | 1.9 | +8.45% |
| 4 | EMA 35 / DEMA 20 | 1.62 | 2.0 | +6.88% |
| 5 | EMA 40 / DEMA 15 | 1.55 | 1.8 | +6.21% |
All five combinations fall within the EMA 30–40 / DEMA 15–20 region — the same cluster identified in the heatmap. The small gaps between rankings and the consistent parameter region reinforce that this is a robust area. The trader selects Rank 2 (EMA 30 / DEMA 20) — it has the highest profit factor and sits in the center of the cluster.