MAE vs MFE Analysis
What it is
Maximum Adverse Excursion (MAE) is the largest unrealized loss a trade experiences before closing. Maximum Favorable Excursion (MFE) is the largest unrealized profit a trade reaches before closing. Together, they reveal how much a trade moves against you (pain) and in your favor (potential) during its lifetime — regardless of where it ultimately closes.
This analysis answers questions that the final P&L cannot: "How much heat did I take on winning trades? How much profit did I leave on the table? Are my stops too tight, or my targets too aggressive?"
MAE/MFE analysis is one of the most direct tools for calibrating stop-loss and take-profit levels based on actual trade behavior rather than theoretical assumptions.
How to access it
Navigate to the MAE / MFE tab in the performance dashboard. Available on Plus and above.
What you see
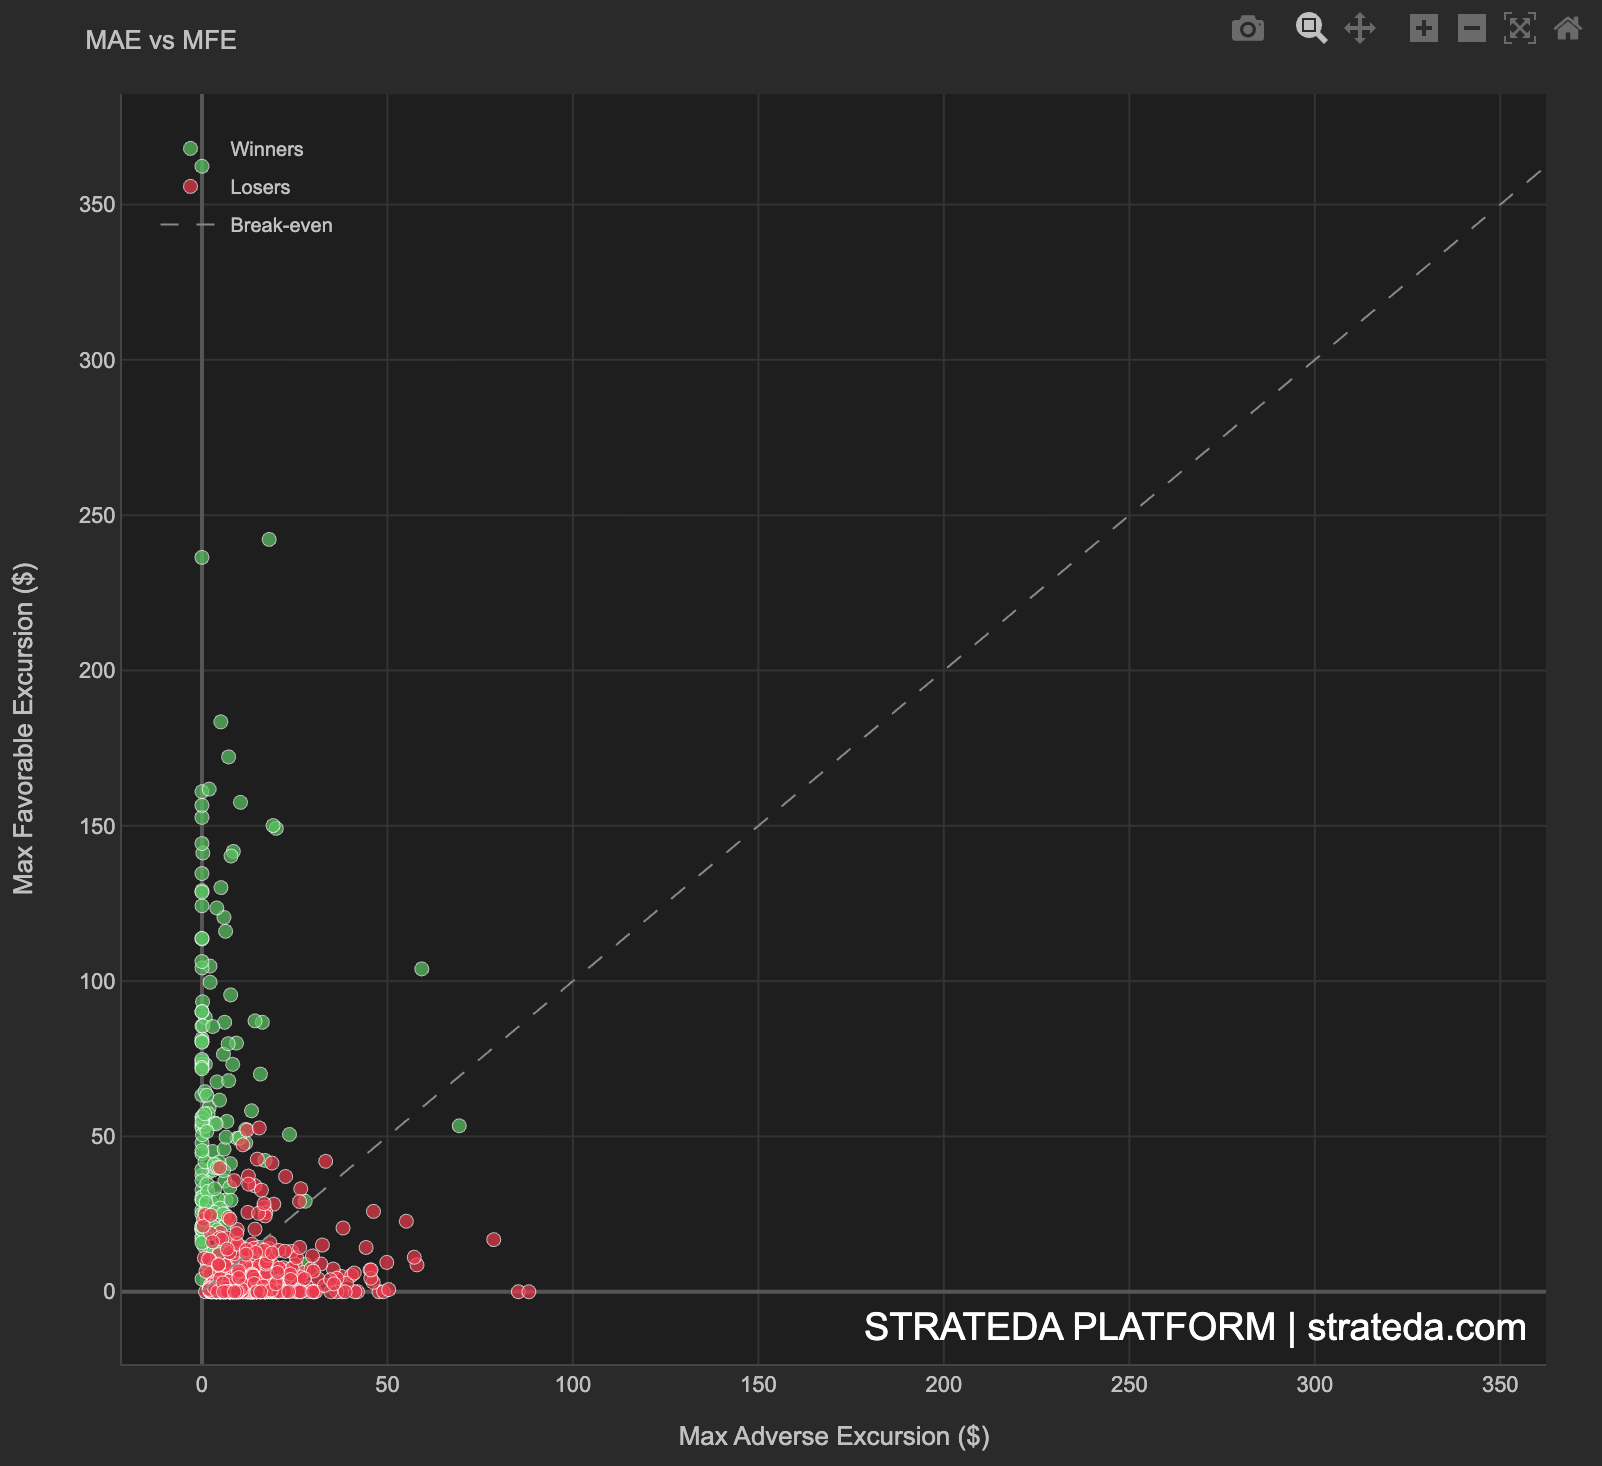
A scatter plot with:
- X-axis — MAE (maximum drawdown during the trade, shown as a negative value or absolute value).
- Y-axis — MFE (maximum run-up during the trade).
- Green dots — Winning trades.
- Red dots — Losing trades.
- Dashed diagonal break-even line — Trades above this line had greater favorable excursion than adverse excursion (MFE > MAE). Trades below the line experienced more adversity than favorable movement. The line represents MAE = MFE.
Each point represents one trade, positioned by how much adverse and favorable movement it experienced during its life.
How to interpret it
Winning trades
Low MAE, high MFE (upper-left region): Winners that experienced little adversity and reached large unrealized profits. These are clean trades — the entry was well-timed and the move was largely in your favor from the start.
High MAE, high MFE (upper-right region): Winners that took significant heat before becoming profitable. These trades eventually worked, but the journey was uncomfortable. If many winners have high MAE, your entries may be premature, or you could benefit from wider initial stops.
Low MAE, low MFE (center-left): Small winners that never moved much in either direction. These are uneventful trades — neither painful nor exciting.
Losing trades
High MAE, low MFE (lower-right region): Trades that moved against you significantly and never recovered. These are the cleanest losses — the signal was wrong, and the market moved against you decisively. A properly placed stop-loss would have caught these.
Low MAE, low MFE (center): Small losses that never moved much. These are stop-outs on trades that went nowhere — often occurring during low-volatility periods.
Moderate MAE, moderate MFE (middle area): Trades that showed promise (moderate favorable excursion) but reversed and became losers. This is the most informative pattern — these trades were profitable at some point. If many losers have meaningful MFE, you may be exiting too late, and a tighter take-profit or trailing stop would capture the unrealized profit.
Stop-loss and take-profit calibration
Stop-loss assessment: Look at the MAE of winning trades. If 95% of winners had MAE below X would have preserved nearly all winners while cutting losers that exceeded that level. If your current stop is significantly tighter, you may be stopping out trades that would have won.
Take-profit assessment: Look at the MFE of losing trades. If many losers reached a meaningful MFE (e.g., $20 unrealized profit) before reversing to a loss, a take-profit at that level would have captured those gains. This is the "left on the table" signal.
Example
MAE vs MFE for 200 trades on a DEMA/EMA crossover on EURCHF:
Winning trades (152 trades, 76% win rate):
- Average MAE: 3.20 at worst)
- Average MFE: 12.80 unrealized profit at best)
- 95% of winners had MAE below $8.50
Losing trades (48 trades):
- Average MAE: $11.40
- Average MFE: 4.20 of unrealized profit on average)
- 62% of losers had MFE above $3.00
Interpretation: Winners show a clean pattern — low adversity (MAE 12.80). The strategy enters near the right time. However, 62% of losing trades briefly showed 4 of favorable movement would have converted approximately 30 of the 48 losers into small winners or breakeven trades, potentially improving the profit factor by 15–20%.
The trader adds this finding to their strategy refinement notes — the crossover exit works well for winners, but a trailing component could capture unrealized gains on trades that ultimately reverse.