Backtest Analytics
What it is
The Backtest Analytics is the central hub for understanding how your live or backtested strategy actually behaves. It goes far beyond a simple equity curve and win rate — Strateda provides 20+ analytics views that examine your strategy's returns from statistical, temporal, risk, and trade-management perspectives. Together, these views answer the questions that separate informed traders from guessing ones: "Is my edge real or lucky? Is it stable or decaying? Where exactly does the strategy make and lose money?"
How to access it
The monitoring dashboard is available after running a backtest or deploying a live strategy via the MT5 Expert Advisor. Basic performance metrics are available on all plans. Full analytics (all charts described in this section) require Pro or Premium plans.
After running a backtest, click the table icon on the loaded equity curve in the View Panel to open the Strategy Analytics dashboard. The table icon is context-dependent — for a single backtest it opens the full metrics and analytics popup. See The Strategy Panel & View System for full details.
What you see
The dashboard is organized into analytics views, each accessible via its own tab:
| Tab | What it reveals |
|---|---|
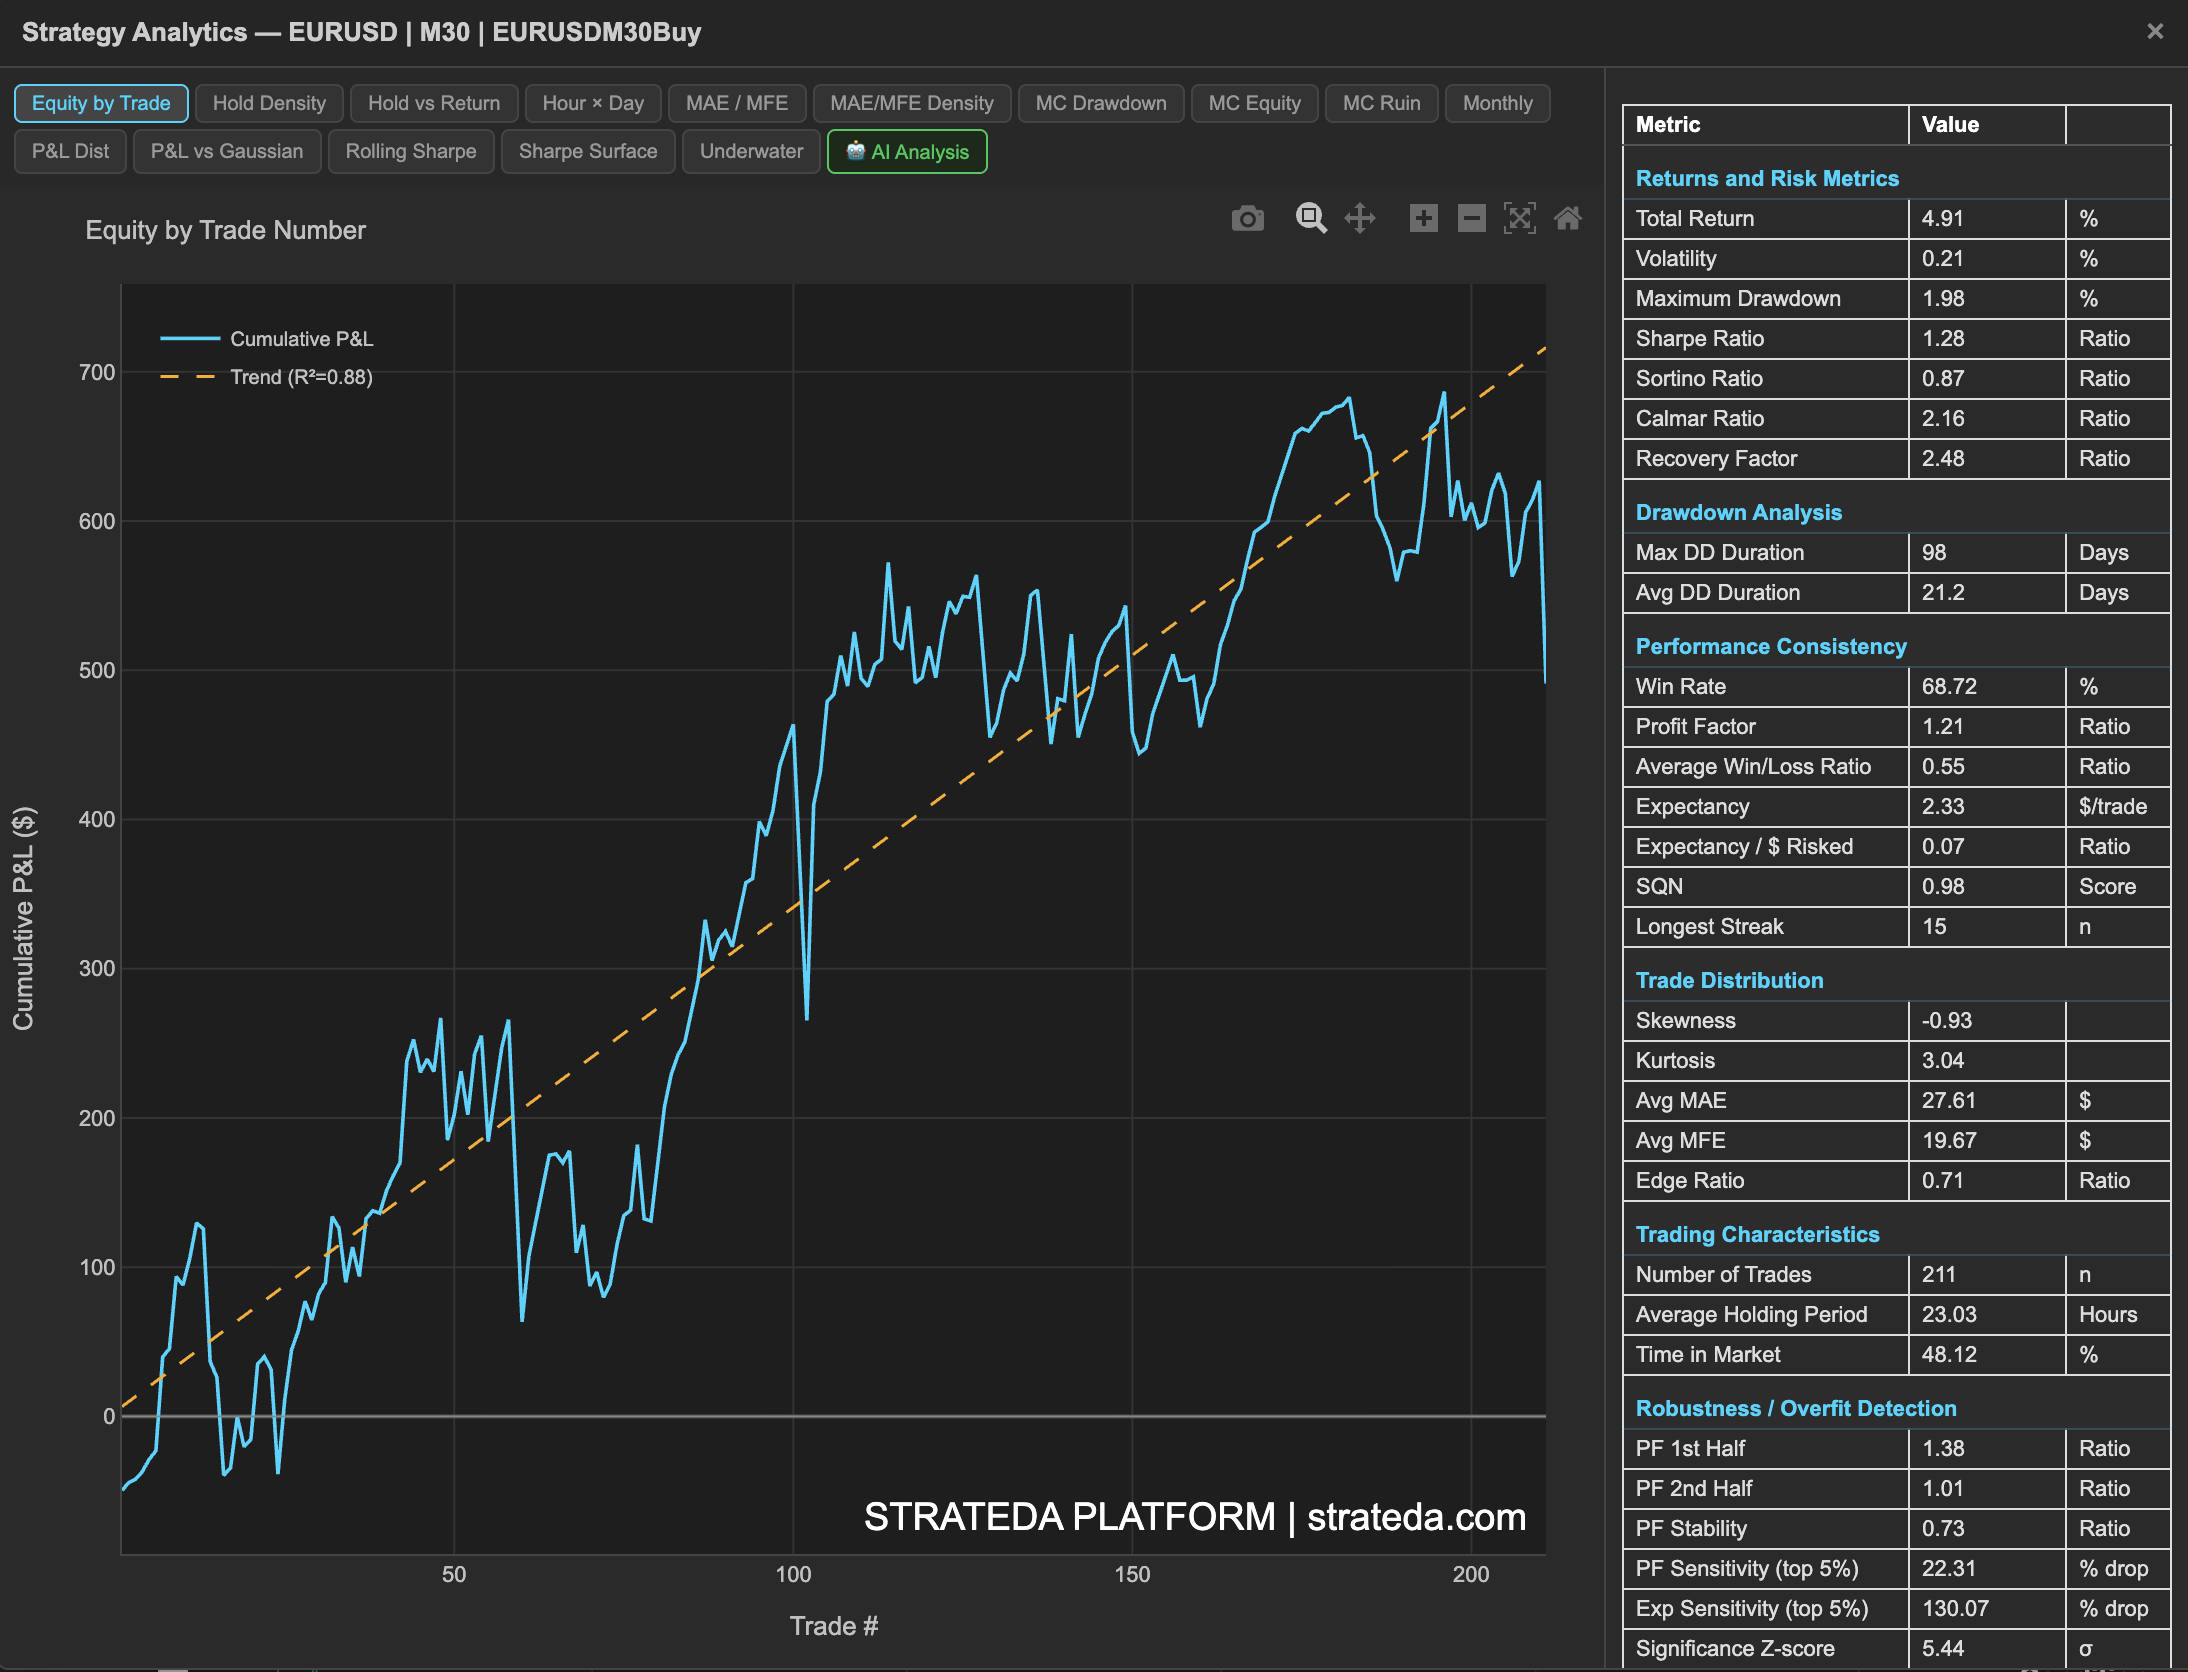
| Equity by Trade | Cumulative P&L with regression trend line and R² fit |
| Hold Density | Distribution of trade holding times |
| Hold vs Return | Relationship between holding duration and trade P&L |
| Hour × Day | Average P&L by hour of day and day of week |
| MAE / MFE | Trade excursion analysis for stop/target calibration |
| MAE/MFE Density | Density view of MAE vs MFE distribution |
| MC Drawdown | Distribution of max drawdown across 1000 simulations |
| MC Equity | Equity cone across 1000 shuffled trade sequences |
| MC Ruin | Probability of hitting each drawdown threshold |
| Monthly | Monthly returns breakdown |
| P&L Dist | Raw P&L distribution histogram |
| P&L vs Gaussian | Fat-tail detection vs normal distribution overlay |
| Rolling Sharpe | Whether risk-adjusted performance is stable or changing |
| Sharpe Surface | Multi-scale regime detection across window sizes |
| Underwater | Drawdown depth and duration over time |
| AI Analysis | AI-generated strategy interpretation |
How to interpret it
Start with the Cumulative P&L to see the big picture — is the equity curve trending up? Then check the Rolling Sharpe to see if performance is stable or deteriorating. Use the Underwater Curve to understand drawdown behavior, and the P&L Distribution to examine the statistical properties of individual trades.
The remaining views provide targeted insights:
- Use Hold Time vs Return and MAE vs MFE to evaluate trade management decisions.
- Use P&L by Time to identify temporal patterns.
- Use P&L vs Gaussian to understand tail risk.
- Use the Rolling Sharpe Surface for advanced regime analysis.
No single view tells the full story. The value is in the combination — cross-referencing multiple views builds a complete picture that no individual metric can provide.
Example
A trader reviews their DEMA/EMA crossover on EURCHF after 200 live trades:
- Cumulative P&L — Steady upward trend with R² of 0.91. The equity curve closely follows the regression line.
- Rolling Sharpe — Averages 0.85 with a dip to 0.2 around trade 80–100 (corresponding to a low-volatility EURCHF period).
- P&L Distribution — Positive skew (+1.2), confirming the strategy captures some large wins.
- Underwater Curve — Maximum drawdown of 1.8%, recovered within 15 trades. No extended drawdown periods.
- P&L by Time — Best performance during 22:00–06:00 UTC (Asian session), consistent with the strategy's momentum capture mechanism.
This multi-view assessment confirms the strategy is performing as validated by WFO, with no unexpected behavior in live deployment.