Underwater Curve (Drawdown)
What it is
The Underwater Curve (also called the drawdown chart) plots the percentage decline from the equity peak at every point in time. When the strategy hits a new equity high, the curve touches zero. When the strategy loses from its peak, the curve dips below zero — and stays there until a new high is reached. The depth and duration of these dips reveal the strategy's risk profile in a way that the equity curve alone doesn't show.
A smooth equity curve can hide meaningful drawdowns. The underwater curve makes every drawdown explicit — how deep, how long, and how frequently they occur.
How to access it
Navigate to the Underwater tab in the performance dashboard. Available on Plus and above.
What you see
- X-axis — Calendar date (the date axis spans the full backtest period).
- Y-axis — Drawdown percentage from peak (always zero or negative).
- Area chart — The space between zero and the drawdown line is filled, creating a visual representation of "being underwater."
- The area fill is rendered in red, with a bright pink/red line tracing the drawdown curve.
- Depth markers — The maximum drawdown point is typically highlighted.
The chart always starts at zero and returns to zero each time a new equity high is reached. The area below zero represents capital at risk relative to the previous peak.
How to interpret it
Drawdown depth
- Max drawdown < 2% — Very conservative. Low-risk strategy with tight control.
- Max drawdown 2–5% — Moderate. Typical for well-managed intraday strategies.
- Max drawdown 5–10% — Significant. Acceptable for some strategy types but requires strong recovery evidence.
- Max drawdown > 10% — High risk. Evaluate whether the return justifies this level of risk exposure.
Drawdown duration
Depth alone doesn't tell the full story. A 3% drawdown that recovers in 5 trades is very different from a 3% drawdown that takes 80 trades to recover:
- Quick recovery (< 20 trades) — The strategy handles adverse periods well and bounces back. Drawdowns are uncomfortable but temporary.
- Extended recovery (20–50 trades) — Moderate. The strategy goes through meaningful periods of underperformance before recovering.
- Very long recovery (50+ trades) — The strategy may have entered a regime where its edge is reduced. Consider whether the edge is genuinely recovering or just slowly reverting to the mean.
Drawdown patterns
Shallow, frequent dips: Many small drawdowns with quick recoveries. This is characteristic of high-win-rate strategies. Psychologically easy to trade, low tail risk.
Rare but deep dips: Infrequent drawdowns, but when they happen, they're substantial. Characteristic of trend-following strategies — long periods of steady gains interrupted by sharp corrections. Psychologically harder to trade.
Progressively deepening dips: Each successive drawdown is deeper than the last. Warning sign — the strategy's risk is increasing over time, possibly due to regime change or position sizing issues.
Single dominant drawdown: One major drawdown dwarfs all others. Check whether this corresponds to an extraordinary market event (news shock, flash crash) or a genuine strategy failure.
Setting drawdown limits
Use the WFO maximum OOS drawdown as your benchmark. If your live drawdown exceeds 2× the maximum OOS drawdown observed in walk-forward analysis, it exceeds the validated risk envelope and warrants pausing the strategy.
Example
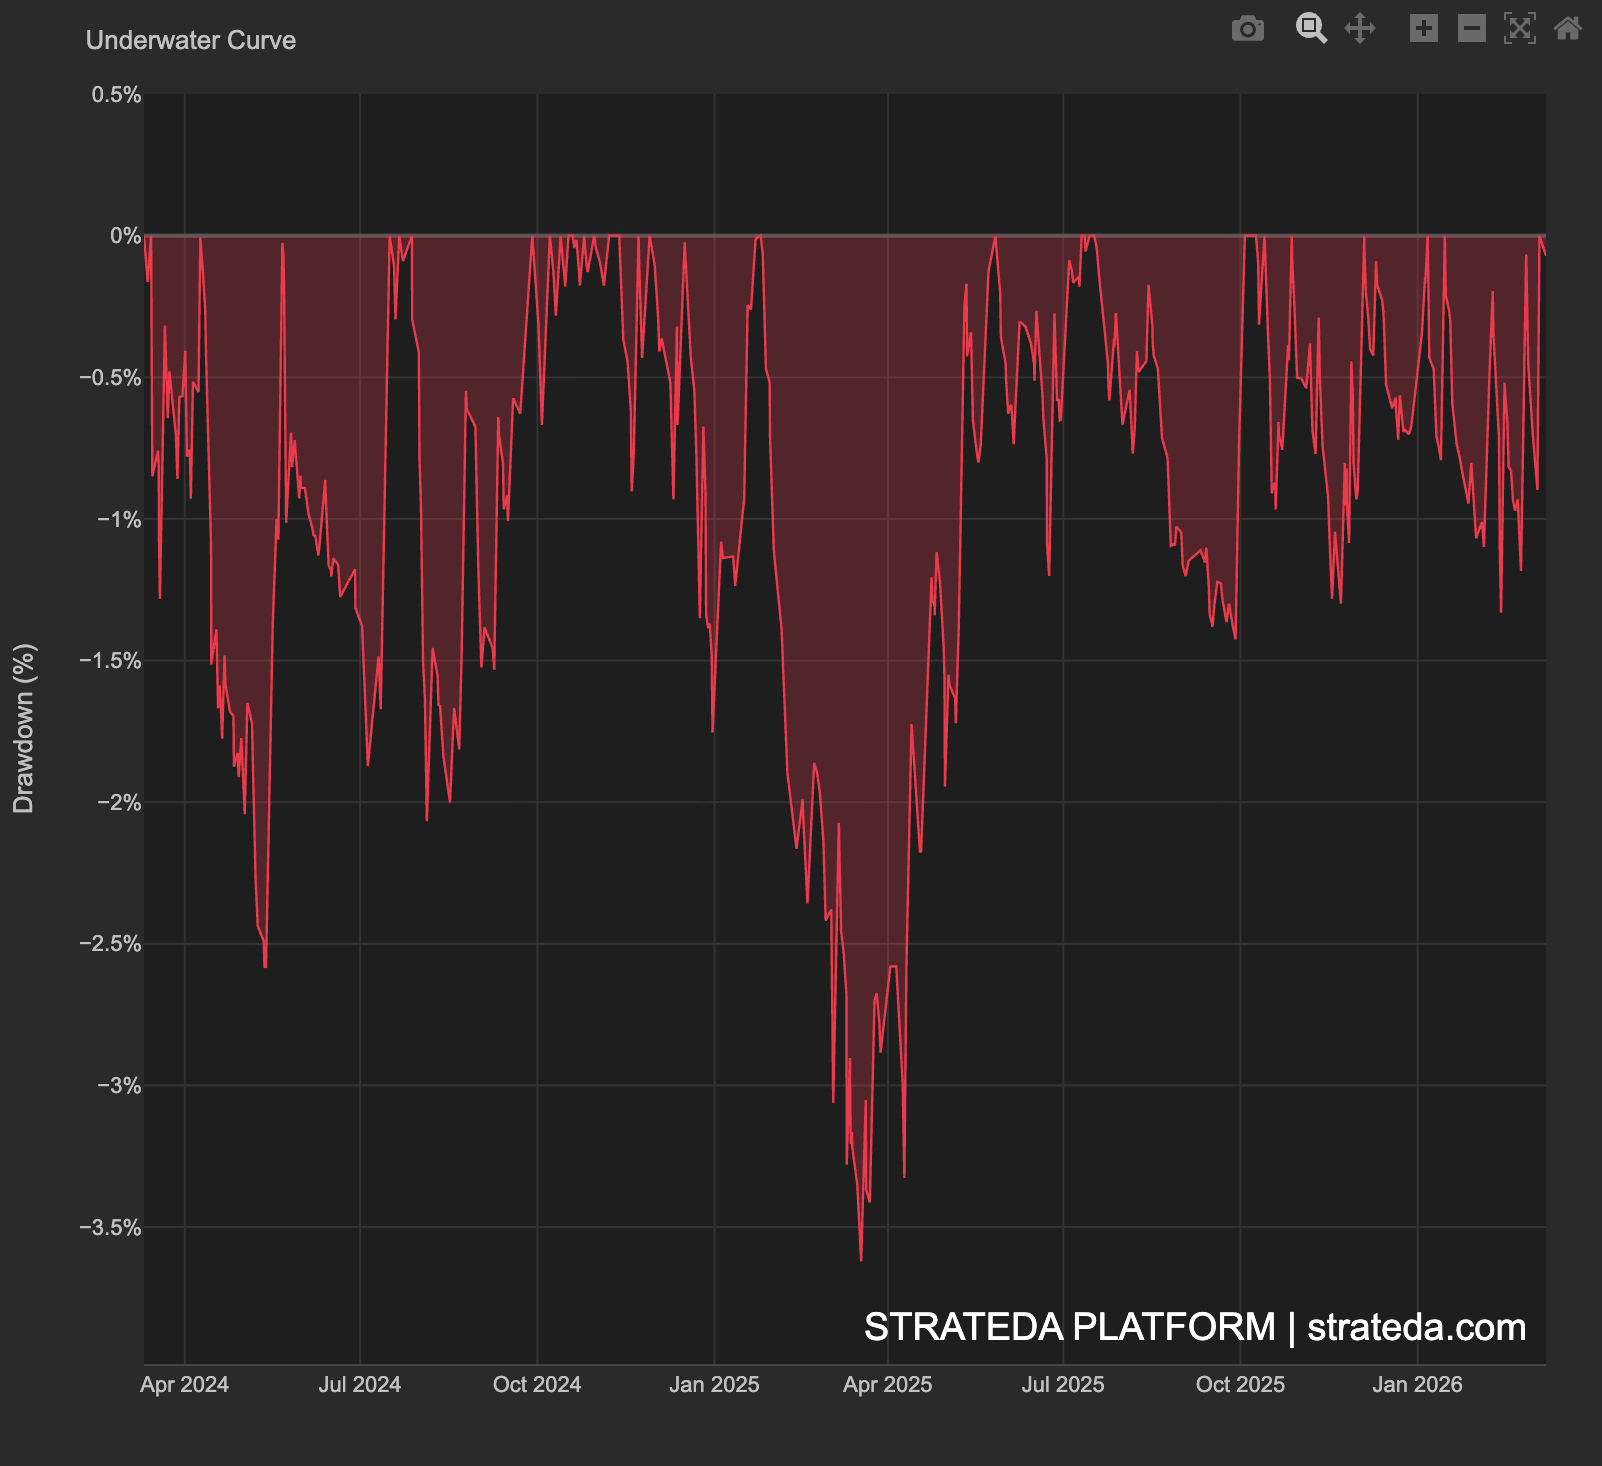
Underwater curve for 200 trades on a DEMA/EMA crossover on EURCHF:
- Maximum drawdown: −1.8% at trade 95 (during the low-volatility period).
- Recovery: 15 trades (from trade 95 to trade 110 to reach a new equity high).
- Typical drawdowns: −0.3% to −0.8%, recovering within 5–10 trades.
- WFO max OOS drawdown: −1.2%. The live max of −1.8% exceeds this but is within the 2× threshold (2.4%).
Interpretation: The drawdown profile is consistent with expectations. The worst drawdown lasted only 15 trades and never approached the 2× WFO threshold. The regular small drawdowns (−0.3% to −0.8%) are typical of a high-win-rate crossover strategy and recover quickly. No progressive deepening or extended recovery periods.