Probability of Ruin
What it is
The Probability of Ruin chart shows the likelihood that your strategy would hit each drawdown threshold across 1000 Monte Carlo simulations. For each threshold (5%, 10%, 15%... 40%, 50%), it answers: "What percentage of simulated trade sequences resulted in a drawdown this large or worse?"
This is the most direct risk management output in the platform. It translates Monte Carlo results into actionable probability estimates for your chosen risk limits. Where the Monte Carlo Equity Simulation shows the range of equity paths and the Max Drawdown Distribution shows the drawdown histogram, this chart converts those distributions into a single question: "How likely am I to lose X% of my account?"
How to access it
Navigate to the MC Ruin tab in the Strategy Analytics popup. Available on Plus and above.
The Strategy Analytics popup is accessed via the table icon in the View Panel after your backtest completes. See The Strategy Panel & View System for full details.
What you see
- Each bar — Probability (%) of hitting that max drawdown threshold across all 1000 simulations.
- Dashed horizontal line — 5% probability reference line. Bars above this line represent drawdown levels with more than a 1-in-20 chance of occurring.
- X-axis — Max Drawdown Threshold (5%, 10%, 15%, 20%, 25%, 30%, 40%, 50%).
- Y-axis — Probability (%).
Bars above the dashed line exceed 5% probability — these thresholds are likely to be hit in live trading and should be planned for.
How to interpret it
Bars above the 5% line
These drawdown levels have more than a 1-in-20 chance of occurring under plausible trade sequencing. You should be prepared for them — they are not edge cases but realistic scenarios. If a drawdown level above the 5% line exceeds your risk tolerance, reduce position size until it falls below.
Setting your risk limit
Find the threshold where the bar drops below the 5% dashed line. That is roughly your 95th percentile worst-case drawdown — a reasonable planning figure for position sizing and capital allocation.
For example, if the 10% threshold bar is at 8% probability (above the line) and the 15% threshold bar is at 2% probability (below the line), your realistic worst case is somewhere between 10% and 15% drawdown. Plan your position sizing so this range is tolerable.
Reading the shape of the bars
Steep drop-off: Probability falls sharply between adjacent thresholds (e.g., 34% at the 5% threshold, 3% at 10%, near-zero at 15%). This means deep drawdowns are very unlikely — the strategy's losses are bounded and consistent. The risk profile is well-defined.
Gradual decline: Probability remains elevated across multiple thresholds (e.g., 40% at 5%, 25% at 10%, 15% at 15%, 8% at 20%). The strategy has fat-tail drawdown risk and could produce deep losses under adverse sequencing. A few large losing trades dominate the drawdown profile. Consider whether your position sizing accounts for this extended risk tail.
Near-zero across all thresholds: The strategy's trades are small enough relative to account size that even the worst ordering cannot produce significant drawdowns. This may indicate overly conservative position sizing — the strategy is very safe but may be underutilising capital.
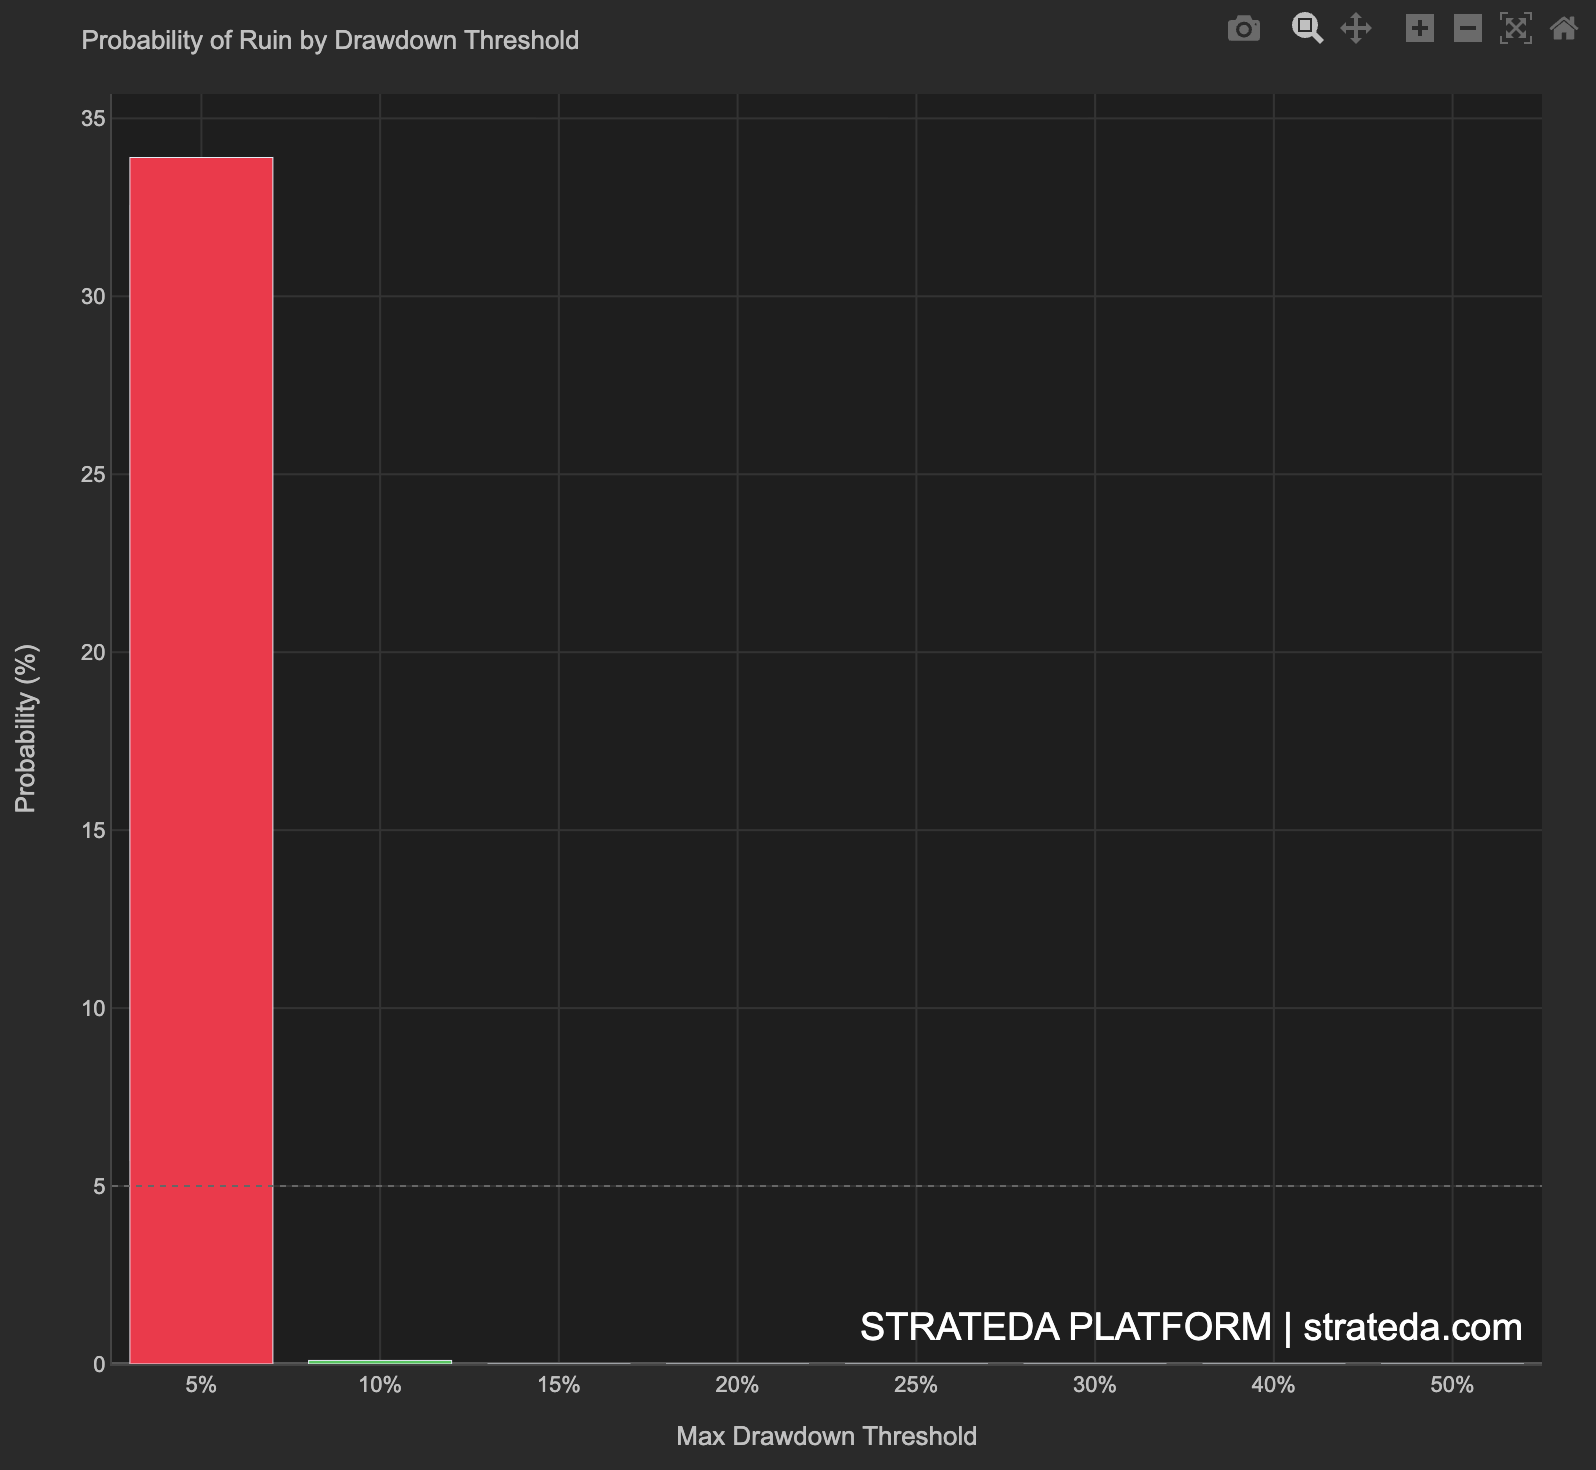
Example
Probability of Ruin for 200 trades on a DEMA/EMA crossover on EURCHF M30:
| Drawdown Threshold | Probability |
|---|---|
| 5% | 34% |
| 10% | 3.2% |
| 15% | 0.1% |
| 20% | 0% |
| 25%+ | 0% |
Interpretation: A 5% drawdown is common and expected — it occurs in roughly one-third of simulated sequences. But a 10% drawdown is rare (3.2%, below the 5% reference line), and anything beyond 15% is essentially impossible with this trade set.
A trader using this strategy on a 500 drawdown as a routine event. A 1,500 are extremely unlikely regardless of trade ordering.
The steep drop-off from 34% to 3.2% between the 5% and 10% thresholds confirms this strategy has bounded, predictable risk. The losses are distributed across many small trades rather than concentrated in a few large ones — consistent with the narrow Monte Carlo equity cone for this same strategy.