Hold Time × Return Density
What it is
The Hold Time × Return Density chart is the density version of the Hold vs Return scatter plot. Instead of individual dots, it uses a 2D kernel density estimate to show where trades concentrate in the hold time / P&L space. The color intensity reveals which combinations of holding duration and return outcome are most common across all trades.
This view is complementary to Hold vs Return — where the scatter shows individual trades, the density view reveals the underlying statistical shape, making patterns clearer when trade counts are high.
How to access it
Navigate to the Hold Density tab in the Strategy Analytics popup. Available on Plus and above.
The Strategy Analytics popup is accessed via the table icon in the View Panel after your backtest completes. See The Strategy Panel & View System for full details.
What you see
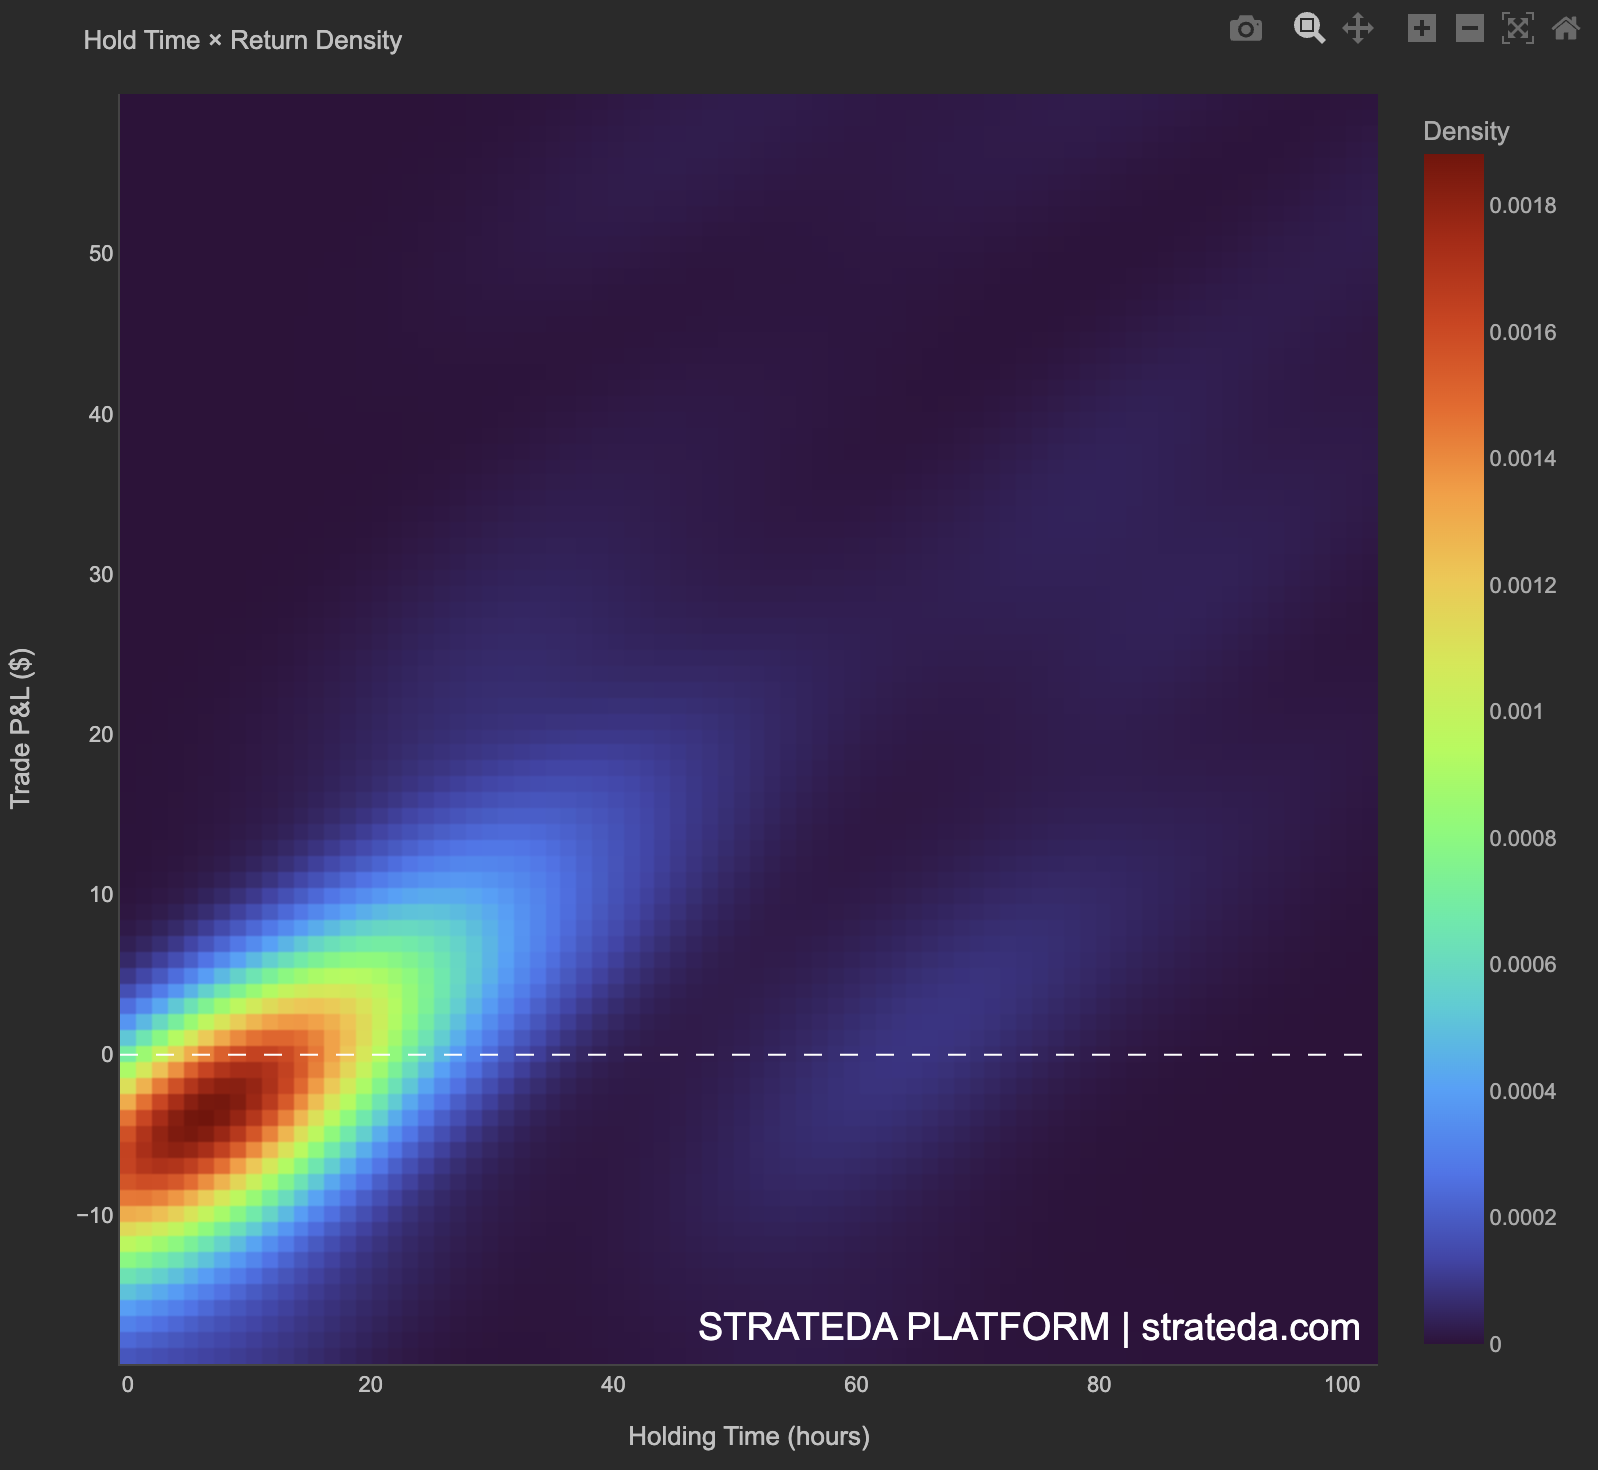
- X-axis — Holding Time (hours).
- Y-axis — Trade P&L ($).
- Color — Density value. Red/orange = highest concentration of trades; blue = moderate concentration; purple/black = sparse or no trades.
- Color scale — Labeled "Density" on the right, ranging from 0 to the peak density value.
- Dashed white horizontal line — Zero P&L reference line separating profitable trades (above) from losing trades (below).
The hottest region (deepest red) reveals where the largest mass of trades clusters — typically at short hold times near breakeven or small positive/negative outcomes.
How to interpret it
Dense hot spot near zero hold time, straddling the zero line
The strategy generates many short-duration trades with small P&L in both directions. This is typical of strategies that frequently enter and exit near their signal threshold. Not inherently bad — check the overall win rate and expectancy to determine if the mass of small trades is net positive.
Hot spot above the zero line
The majority of trades are profitable. The density peak sitting in positive P&L territory indicates the strategy's typical outcome is a small win, which is a healthy foundation.
Hot spot below the zero line
The majority of trades lose. Even if the overall P&L is positive (due to occasional large wins), the typical trade experience is a loss — which can be psychologically difficult to sustain in live trading.
Density extends horizontally at positive P&L
The profitable region of the density map spreads toward longer hold times, indicating that winners tend to be held longer — a sign of healthy trade management where the strategy lets profits run.
Density compressed at short hold times only
All trade mass is clustered at very short durations. The strategy rarely holds positions for extended periods. Check whether this is by design (tight exits) or a signal quality issue (trades reverse quickly).
Relationship to Hold vs Return
The Hold Density and Hold vs Return tabs show the same underlying data in different forms. Use Hold vs Return to inspect individual trades and identify outliers. Use Hold Density to understand the statistical shape of the full distribution — particularly useful when trade counts are high and the scatter plot becomes crowded.
Example
Hold Time × Return Density for 200 trades on a DEMA/EMA crossover on EURCHF M30:
- Primary hot spot: Deep red cluster at 2–8 hours hold time, P&L between −100. Most trades are short-duration with small outcomes.
- Secondary warm region: Orange extending rightward from 8–30 hours in positive P&L territory (+200). Winners are held longer than losers.
- Cold region: Purple/black at hold times above 40 hours — very few trades last this long.
- Zero line: The hot spot sits slightly above the zero line — the strategy's typical trade is a small win.
Interpretation: The density confirms that the strategy's edge comes from a mass of small wins at short holding periods, supplemented by occasional larger wins that are held longer. The asymmetry — winners spreading rightward while losers cluster at short durations — is consistent with a well-designed exit strategy that cuts losses quickly and lets profits run. Cross-reference with the Hold vs Return scatter to inspect the individual outlier trades that fall outside the main density region.